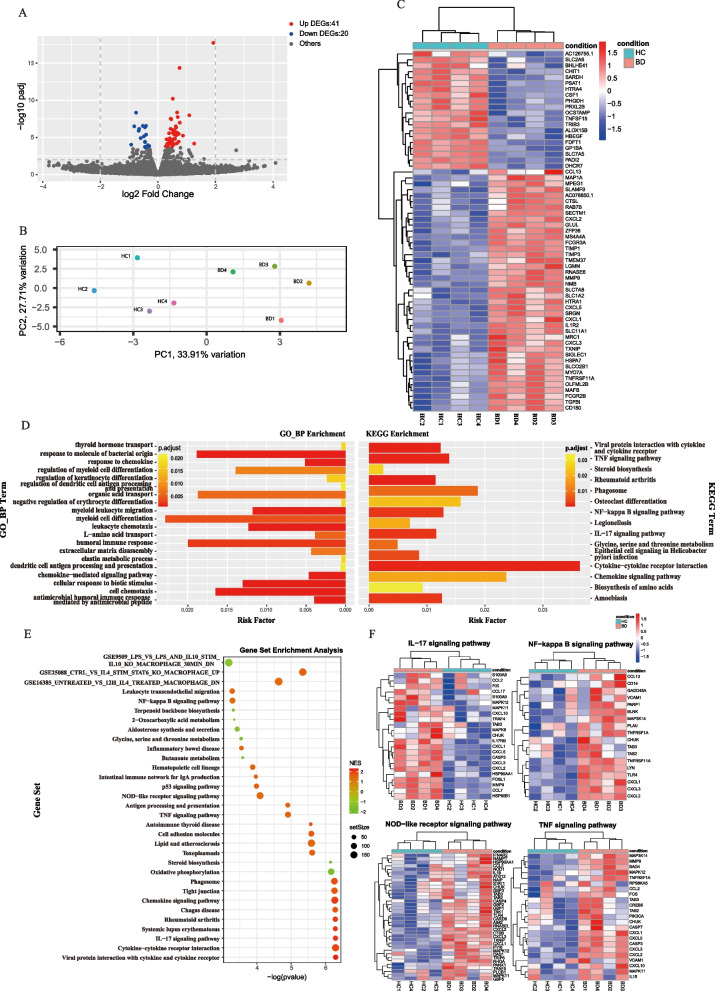
Fig. 3.
Transcriptome analysis of BD serum- and HC serum-treated macrophages. HMDMs were stimulated with serum from four treatment-naïve active BD patients and matched healthy volunteers for 48 h, and total RNA was extracted for RNA-seq analysis. A Principal component analysis (PCA) of BD serum-treated and HC serum-treated macrophages. B Volcano plot of upregulated (red, n=41) and downregulated (blue, n=20) DEGs in BD serum-treated macrophages compared with HC serum-treated macrophages. C Heatmap of DEGs between BD serum- and HC serum-treated macrophages. D GO biological process enrichment analysis and KEGG enrichment analysis between BD serum- and HC serum-treated macrophage. E, F Dot plots (left) showed Gene Set Enrichment Analysis (GSEA) of BD serum- and HC serum-treated macrophage. Representative enriched gene sets were illustrated by heatmap (right). DEGs, differentially expressed genes; GO, gene ontology; KEGG, Kyoto Encyclopedia of Genes and Genomes

