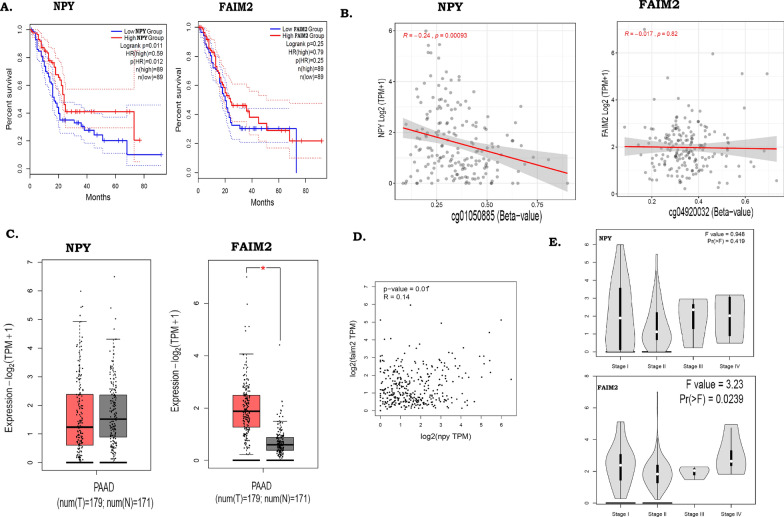
Fig. 6.
Differential methylation and expressions of NPY and FAIM2 in the TCGA cohort. A Differential survival of patients in the TCGA cohort with “high” and “low” expressions of NPY and FAIM2. B Correlations between beta value and gene expression of NPY and FAIM2, among the cancer samples of the TCGA cohort. C Differences in expressions of NPY and FAIM2 genes between cancer and normal samples of the TCGA cohort. D Correlation between the expressions of FAIM2 and NPY genes in the TCGA cohort cancer samples. E Expression levels of FAIM2 and NPY genes across stages of cancer

