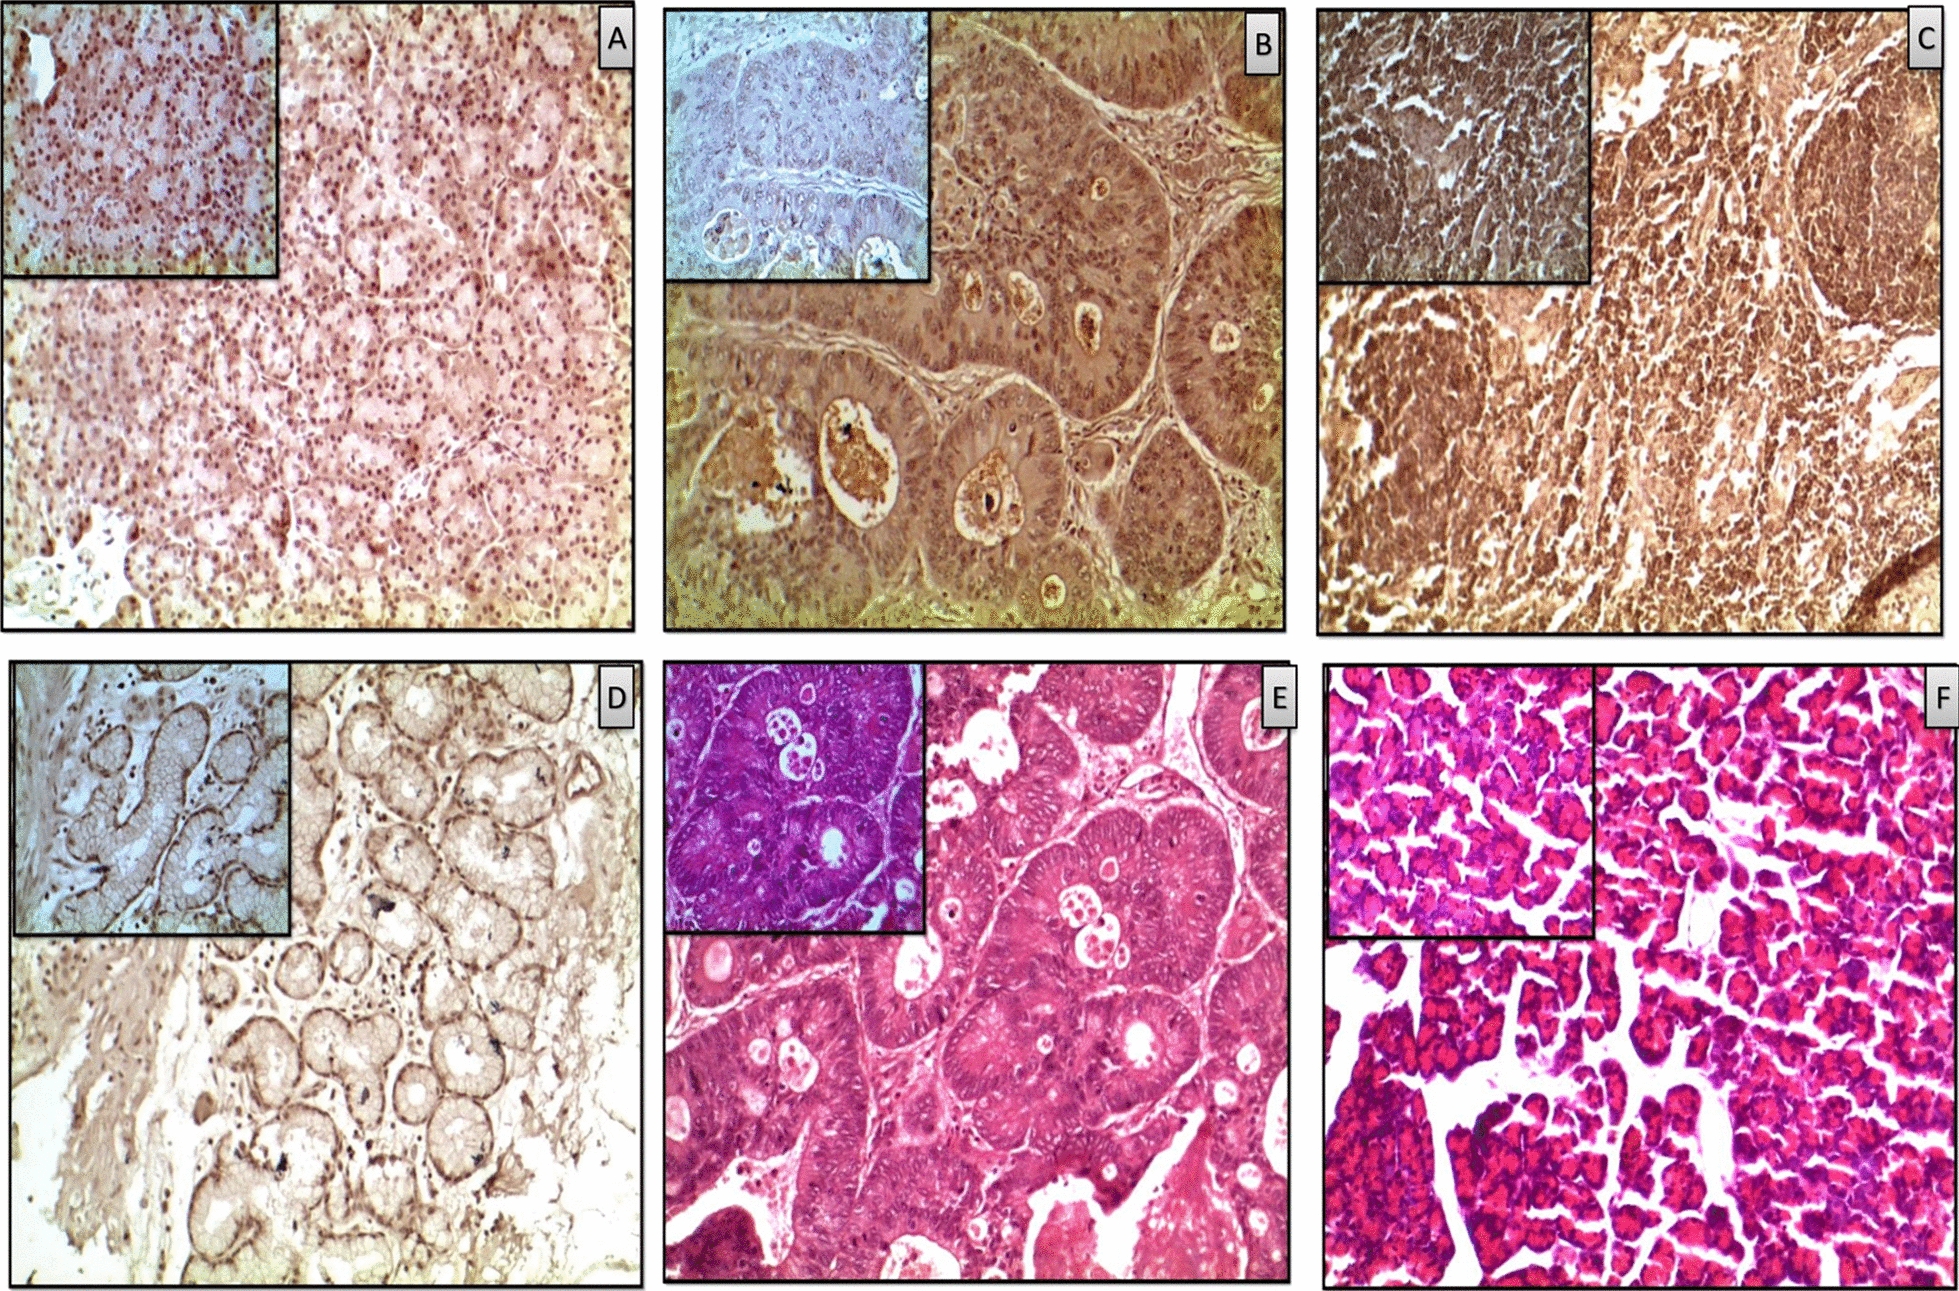
Fig. 7.

Representative images of immunohistochemistry (IHC) showing expressions of Faim2 and Npy proteins in PDAC and paired control tissues (n = 20): Antibody specific to Npy and Faim2, were used for comparison and images were clicked at both 20× and 40×. Every Slide consisted of 3 independent sections for IHC. The representation is expression of Npy in normal tissues (A) and in cancer (B). Expression of Faim2 in normal (C) and in cancer (D). A and C took more browner spotsin normal cells than (B) and (D) of the proteins in compared to cancer tissues. E and F H&E section of both tumour and normal were taken at similar resolutions. The bigger figures were taken in 20× and the sub-figures in smaller boxes were taken in 40×. Every sample had 3 sections on a slide with similar results to avoid technical biasness
