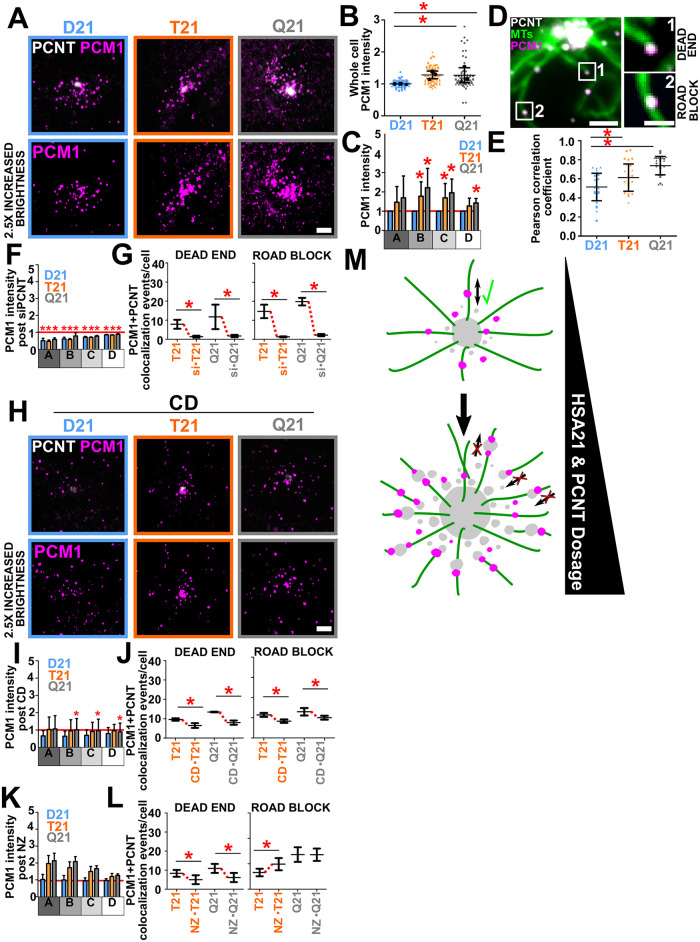
FIGURE 4:
PCNT-associated free MTs and trafficking puncta inhibit proper localization of centriolar satellites. (A) D21, T21, and Q21 RPE-1 cells stained for PCNT (PCNT; grayscale) and PCM1 (PCM1; magenta). Brightness increased by a factor of 2.5. Scale bar, 3 μm. (B) D21, T21, and Q21 whole-cell PCM1 fluorescence intensity. Intensity values normalized to D21 average. Statistical comparisons made to D21 averages. Mean ± SD. *, p < 0.05 (Supplemental Table S1). (C) D21, T21, and Q21 regional binned PCM1 fluorescence intensities. Intensity values normalized to D21 average (indicated with red line). Statistical comparisons made to D21 averages. Mean ± SD. *, p < 0.05 (Supplemental Table S1). (D) PCM1 colocalizes with PCNT along MTs and at MT ends. Unciliated D21 RPE-1 cell stained for PCNT (PCNT; grayscale), MTs (DM1A; green), and PCM1 (PCM1; magenta). Labels are referenced in right panels. Scale bar, 2 μm and 1 μm for insets. (E) PCM1 and PCNT colocalization increases with HSA21 ploidy. Mean ± SD. *, p < 0.05 (Supplemental Table S1). (F) Reducing PCNT via siRNA reduces regional PCM1 intensities in D21, T21, and Q21 RPE-1 cells. Red line denotes D21 siControl intensity. Statistical comparisons made to control intensities for each cell type. Mean ± SD. *, p < 0.05 (Supplemental Table S1). (G) Reducing PCNT via siRNA reduces PCM1 colocalization with PCNT at MT ends (dead end) and along MTs (roadblock) in T21 and Q21 RPE-1 cells. Mean ± SD. *, p < 0.05 (Supplemental Table S1). (H) D21, T21, and Q21 RPE-1 CD-treated cells stained for PCNT (PCNT; grayscale) and PCM1 (PCM1; magenta). Fluorescence intensity brightness increased by a factor of 2.5. Scale bar, 3 μm. (I) CD reduces regional PCM1 intensities in D21, T21, and Q21 RPE-1 cells. Red line denotes D21 control intensity. Statistical comparisons made to relative control intensities for each cell type. Mean ± SD. *, p < 0.05 (Supplemental Table S1). (J) CD reduces PCM1 colocalization with PCNT at MT ends and along MTs in T21 and Q21 RPE-1 cells. Mean ± SD. *, p < 0.05 (Supplemental Table S1). (K) NZ does not reduce regional PCM1 intensity. Red line indicates D21 control intensity. (L) NZ reduces PCM1 colocalization with PCNT at MT ends and increases PCM1 colocalization with PCNT along MTs in T21 cells. Mean ± SD. *, p < 0.05 (Supplemental Table S1). (M) Elevated PCNT caused by HSA21 dosage increases PCNT at the centrosome (Figure 1; Galati et al., 2018), along MTs, and at MT ends. PCNT associated with MT ends are more distant from the centrosome and we propose that this population creates trafficking dead ends, inhibiting the ability for PCM1 to traffic to the centrosome. Enlarged PCNT puncta along MTs might increase trafficking roadblocks that inhibit the ability for PCM1 to traffic to and from the centrosome. The inability for proteins to efficiently traffic to and from the centrosome likely inhibits primary cilia formation. PCM1; magenta. PCNT; gray. MTs; green.

