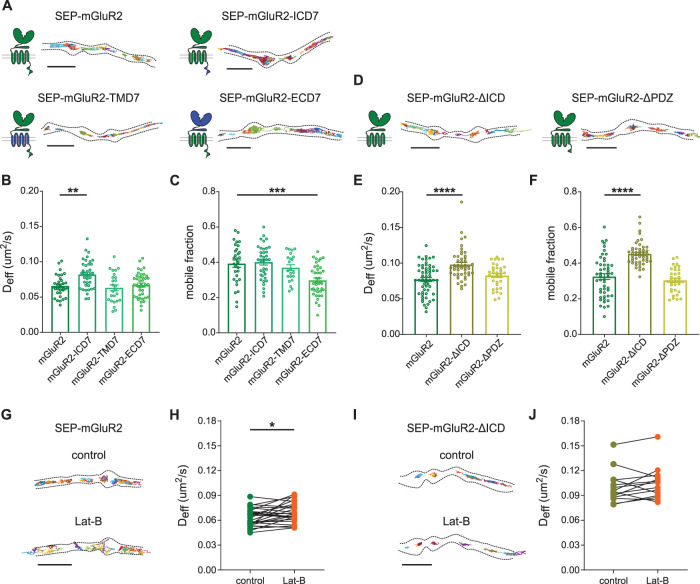
FIGURE 3:
Intracellular interactions regulate the mobility of presynaptic mGluR2. (A) Schematic diagrams and example trajectories of wild-type and chimeric variants of mGluR2 (green) with the ICD, TMD, and ECD exchanged with the corresponding mGluR7 domains (blue). Scale bar, 2 µm. (B, C) Quantification of average diffusion coefficient (Deff), B, and the mobile fraction, C, of SEP-tagged chimeric mGluR2 variants (n = 30 fields of view for mGluR2, 40 fields of view for mGluR2-ECD7 from five independent experiments, 36 fields of view for mGluR2-ICD7 and 22 fields of view for mGluR2-TMD7 from four independent experiments). (D) Schematic diagrams and example trajectories of C-terminal deletion variants of mGluR2. Scale bar, 2 µm. (E, F) Quantification of average diffusion coefficient (Deff), E, and the mobile fraction, F, of SEP-tagged C-terminal deletion variants of mGluR2 (n = 50 fields of view for mGluR2, 49 fields of view form mGluR2-ΔICD, and 34 fields of view for mGluR2-ΔPDZ from three independent experiments). One-way ANOVA followed by Dunnett’s multiple comparison test; **P < 0.005, ***P < 0.0005. (G) Example trajectories of SEP-mGluR2 before and after incubation with 5 µM latrunculin B (Lat-B). Scale bar, 2 µm. (H) Quantification of diffusion coefficient (Deff) of SEP-mGluR2 before and after incubation with Lat-B (n = 27 fields of view, from three independent experiments). Paired t test, * P < 0.05. (I) Example trajectories of SEP-mGluR2-ΔICD before and after incubation with Lat-B. Scale bar, 2 µm. (J) Quantification of diffusion coefficient (Deff) of SEP-mGluR2-ΔICD before and after incubation with Lat-B (n = 14, from two independent experiments). Error bars represent SEM. All trajectories are displayed with random colors. Outlines of cells are based on the TIRF image of SEP signal. See also Supplemental Figure S3.

