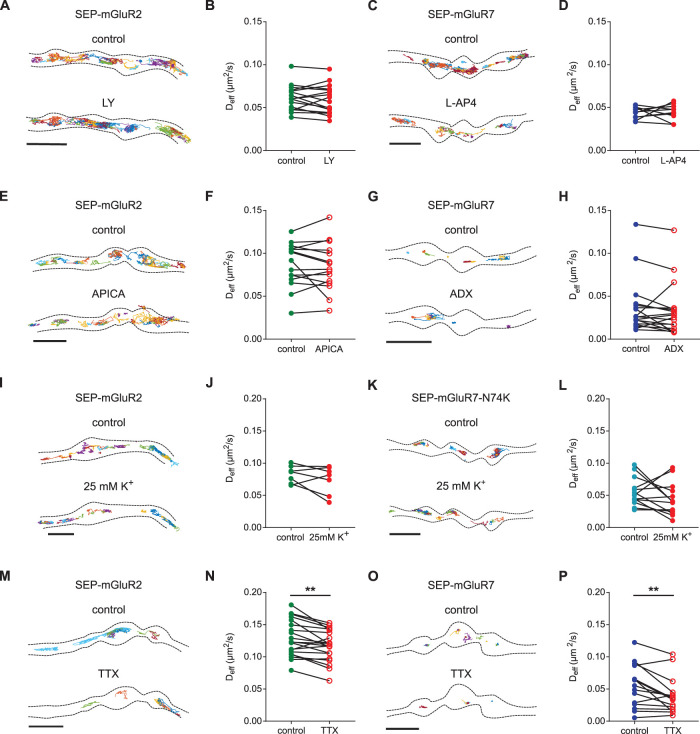
FIGURE 5:
Lateral diffusion of presynaptic mGluRs is not regulated by activity. (A) Example trajectories of SEP-mGluR2 before and after incubation with 100 µM LY. Scale bar, 2 µm. (B) Quantification of diffusion coefficient (Deff) of SEP-mGluR2 before and after incubation with LY (n = 17 fields of view from two independent experiments). (C) Example trajectories of SEP-mGluR7 before and after incubation with 500 µM L-AP4. Scale bar, 2 µm. (D) Quantification of diffusion coefficient (Deff) of SEP-mGluR7 before and after incubation with L-AP4 (n = 10 fields of view from two independent experiments). (E) Example trajectories of SEP-mGluR2 before and after incubation with 100 µM APICA. Scale bar, 2 µm. (F) Quantification of diffusion coefficient (Deff) of SEP-mGluR2 before and after incubation with APICA (n = 15 fields of view from three independent experiments). (G) Example trajectories of SEP-mGluR7 before and after incubation with 10 µM ADX. Scale bar, 2 µm. (H) Quantification of diffusion coefficient (Deff) of SEP-mGluR7 before and after incubation with ADX (n = 18, from four independent experiments). (I) Example tracks of SEP-mGluR2 before and after incubation with 25 mM K+. Scale bar, 2 µm. (J) Quantification of diffusion coefficient (Deff) of SEP-mGluR2 before and after incubation with 25 mM K+ (n = 7 fields of view from two independent experiments). (K) Example tracks of SEP-mGluR7-N74K before and after incubation with 25 mM K+. Scale bar, 2 µm. (L) Quantification of diffusion coefficient (Deff) of SEP-mGluR7-N74K before and after incubation and with 25 mM K+ (n = 13 fields of view from two independent experiments). (M) Example trajectories of SEP-mGluR2 before and after incubation with 1 µM TTX. Scale bar, 2 µm. (N) Quantification of diffusion coefficient (Deff) of SEP-mGluR2 before and after incubation with TTX (n = 20 from three independent experiments). (O) Example trajectories of SEP-mGluR7 before and after incubation with 1 µM TTX. Scale bar, 2 µm. (P) Quantification of diffusion coefficient (Deff) of SEP-mGluR7 before and after incubation with TTX (n = 15 from three independent experiments). All trajectories are displayed with random colors. Outlines of cells are based on the TIRF image of SEP signal. Paired t test, **P < 0.005. See also Supplemental Figure S4.

