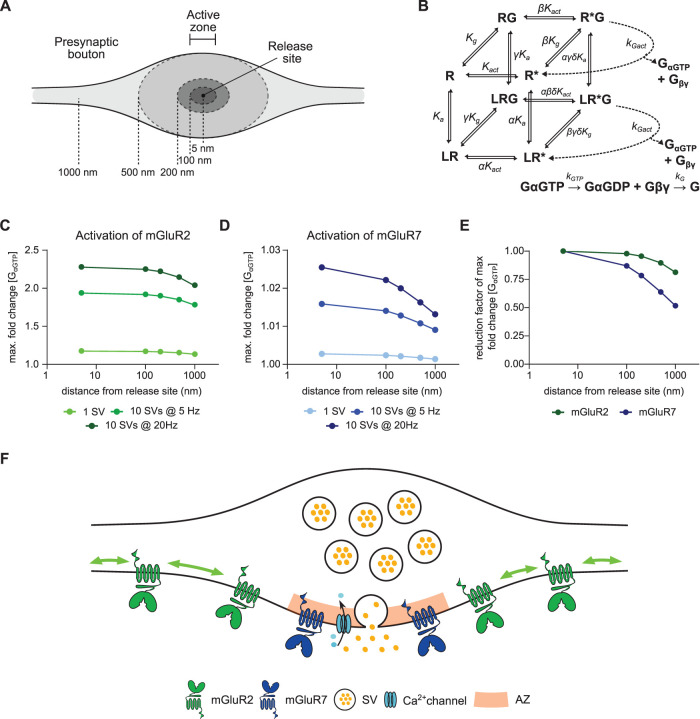
FIGURE 6:
A computational model of mGluRs activation shows that subsynaptic localization of presynaptic mGluRs tunes receptor activation. (A) Schematic of presynaptic bouton highlighting subsynaptic localizations used in modeling. (B) Kinetics and rate equations described in the cubic ternary complex activation model of presynaptic mGluRs signaling. All parameters used in the model are summarized in Supplemental Table S1. (C, D) Receptor response to glutamate release during different release patterns (1 SV, 10 SVs at 5 Hz, and 10 SVs at 20 Hz) at different distances from release site (5 nm to 1 µm) for mGluR2, C, and mGluR7, D. Note that the x-axes are on a logarithmic scale. (E) The normalized reduction factor of mGluR2 and mGluR7 activation at different distances from the release site after release of 10 SVs at 20Hz. Note that the x-axis is on a logarithmic scale. (F) A model of subsynaptic distribution and mobility of presynaptic mGluRs. mGluR2 is distributed along the axon and displays high mobility that is modulated by its intracellular interactions. mGluR7 is enriched and immobilized at the active zone. Immobilization of mGluR7 is regulated by its extracellular domain. SV—synaptic vesicle, AZ—active zone. See also Supplemental Figure S5, Supplemental Tables S1 and S2.

