FIGURE 1:
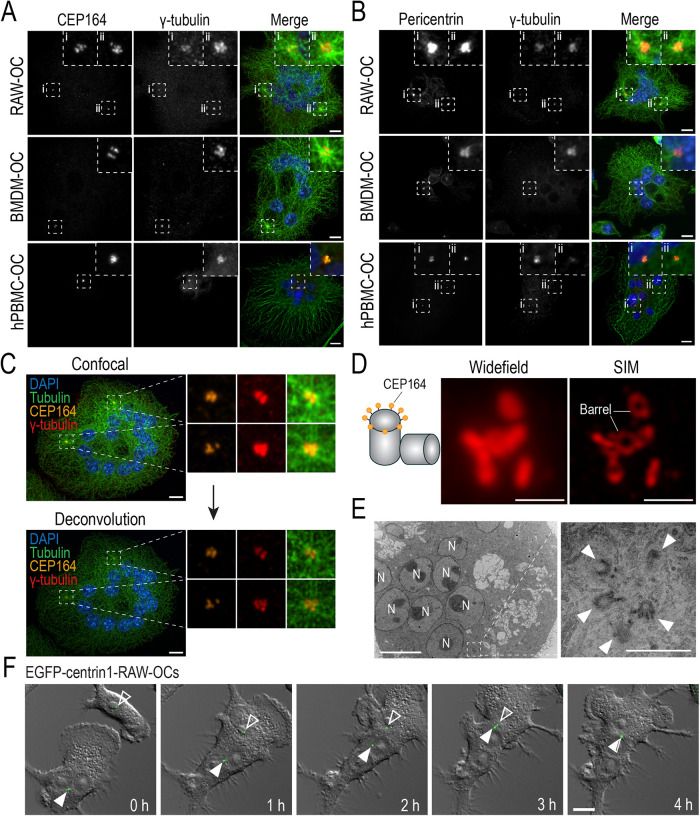
Structural components of functional centrosomes are present and organized into clusters in RAW-, BMDM-, and hPBMC-derived osteoclasts. (A and B) Representative immunofluorescent images of fixed end-point RAW-, BMDM-, and hPBMC-derived osteoclasts immunostained for centriolar and pericentriolar components. (A) Osteoclasts immunostained with DAPI (blue), tubulin (green), CEP164 (orange), and γ-tubulin (red) to label nuclei, MTs, the mother centriole, and γ-TuRCs, respectively. (B) Osteoclasts immunostained with DAPI (blue), tubulin (green), pericentrin (orange), and γ-tubulin (red) to label nuclei, MTs, the PCM, and γ-TuRCs, respectively. Dashed box insets show centrosomal signal clusters. (C) Iterative deconvolution of coalesced centrosomal signals in osteoclasts. Osteoclasts were immunostained with DAPI (blue), tubulin (green), CEP164 (orange), and γ-tubulin (red) to label nuclei, MTs, the mother centriole, and γ-TuRCs, respectively. (D) Widefield and SIM imaging of a CEP164-immunostained centrosome cluster in a RAW-derived osteoclast. (E) TEM imaging of centrosomes in RAW-derived osteoclasts. N represents nuclei and arrowheads indicate individual centrioles. Scale bars = 10 μm for panels A–C, F. Scale bars = 1 μm for D and E. (F) Representative epifluorescent live-cell imaging of EGFP-centrin1-transduced RAW cells cultured with 100 ng/ml RANKL for 2.5 d (see Supplemental Movie S1). Images display time-lapse frames of early osteoclast fusion and centrosome clustering. White arrowheads indicate clustered centrosomes in the osteoclast and open arrowheads indicate the lone centrosome in the fusion partner.

