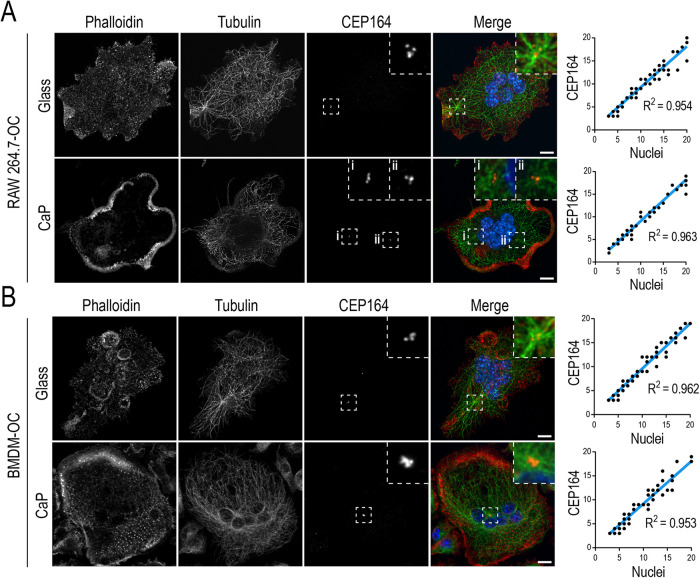
FIGURE 2:
Centrosome number correlates with nuclei number in nonresorbing and resorbing RAW- and BMDM-derived osteoclasts. (A) Representative fixed RAW-derived osteoclasts cultured on glass (n = 70) and biomimetic CaP-coated (n = 59) glass coverslips. (B) Representative fixed BMDM-derived osteoclasts cultured on glass (n = 69) and biomimetic CaP-coated (n = 71) glass coverslips. Osteoclasts were labeled for nuclei, F-actin, MTs, and centrosomes with DAPI (blue), phalloidin (red), tubulin (green), and CEP164 (orange), respectively. F-actin labeling was performed to observe bone resorptive structures. Linear regression curves of centrosomes in a range of small (3–5 nuclei) to large (11+ nuclei) osteoclasts were quantified by scoring the number of CEP164 signals against the number of nuclei. Dashed box insets show centrosome clusters. Scale bar = 10 μm.

