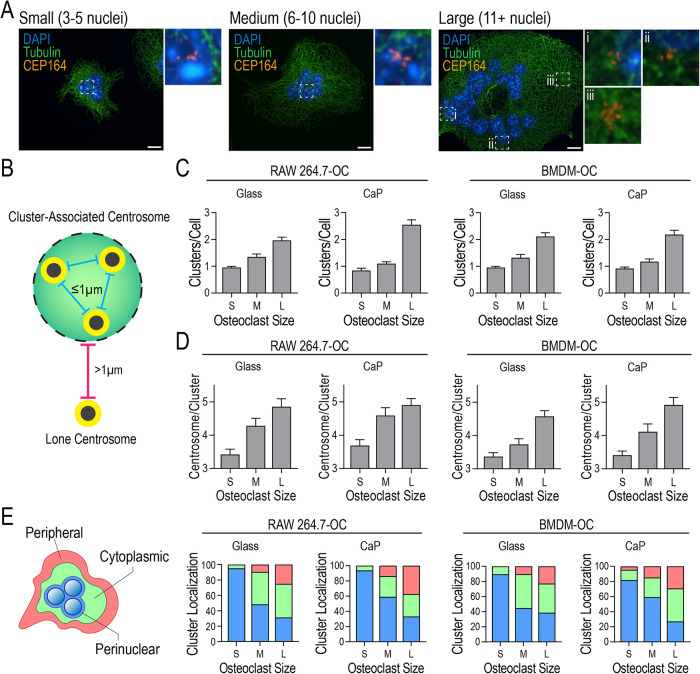
FIGURE 3:
Centrosome clustering and localization in nonresorbing and resorbing RAW- and BMDM-derived osteoclasts varies with cell size. (A) Representative images of centrosome clusters in small (S; 3–5 nuclei/cell), medium (M; 6–10 nuclei/cell), and large (L; 11+ nuclei/cell) osteoclasts stained for DAPI (blue), tubulin (green), and CEP164 (orange). Dashed box insets show centrosome clusters. Scale bars = 10 μm. (B) Illustration of lone and cluster-associated centrosomes. A cluster is defined as at least three centrosomes with less than 1 μm distance from adjacent centrosomes. (C) Distribution of the number of centrosome clusters per osteoclast for RAW-derived osteoclasts cultured on glass or CaP and BMDM-derived osteoclasts on glass and CaP (n ≥ 60). (D) Distribution of the number of centrosomes within each cluster in RAW-derived osteoclasts plated on glass or CaP and BMDM-derived osteoclasts plated on glass and CaP (n ≥ 60). (E) Schematic of three cellular localization zones and the corresponding distributions of cluster locations in osteoclasts plated on glass or CaP.

