FIGURE 4:
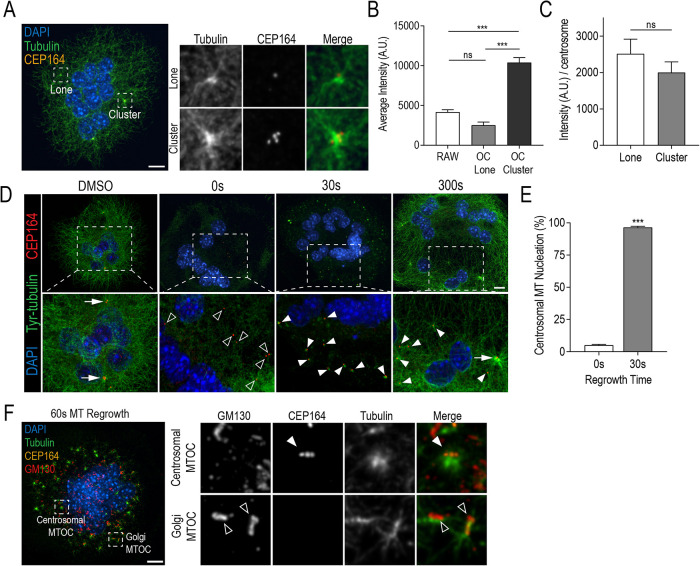
Clustered centrosomes have strong MTOC capacity with individual centrosomes retaining MT nucleation ability. (A) Representative RAW-derived osteoclasts stained with DAPI (blue), tubulin (green), and CEP164 (orange). (B) Quantification of total tubulin fluorescence at lone centrosomes and centrosome clusters in unstimulated RAWs and osteoclasts. Graph displays total mean intensity ± SEM from three independent experiments (n = 30). Significance was determined via a one-way ANOVA followed by Tukey’s multiple comparison (***P < 0.001). (C) Quantification of total tubulin fluorescence per centrosome for lone and clustered centrosomes in osteoclasts. Significance was determined by Student’s t test (*P < 0.05). (D) Representative images of osteoclasts after MT regrowth assays. Cells were fixed and stained for DAPI (blue), tyrosinated (Tyr) tubulin (green), and CEP164 (orange) at indicated recovery time points in order to visualize MT regrowth. Dashed box insets show detailed centrosomal and MT nucleation signals. White arrows indicate clustered CEP164 signals, open arrowheads indicate lone CEP164 signal, and closed arrowheads indicate centrosomal MT nucleation sites. (E) Quantification of % MT nucleation at 0 and 30 s of MT regrowth. Nucleating centrosomes were defined as CEP164 signal colocalized with Tyr-tubulin signal. Graph displays mean ± SEM from three independent samples (n = 30) where significance was determined by Student’s t test (***P < 0.001). (F) Representative osteoclast after 60 s of MT regrowth. Cells were stained with DAPI (blue), tubulin (green), GM130 (red), and CEP164 (orange). Dashed boxes show location of expanded panels for centrosomal and Golgi MTOCs. White arrowhead indicates a radial MT aster colocalizing with centrosomes and open arrowheads indicate MTs colocalizing with Golgi. Scale bars = 10 μm.

