FIGURE 5:
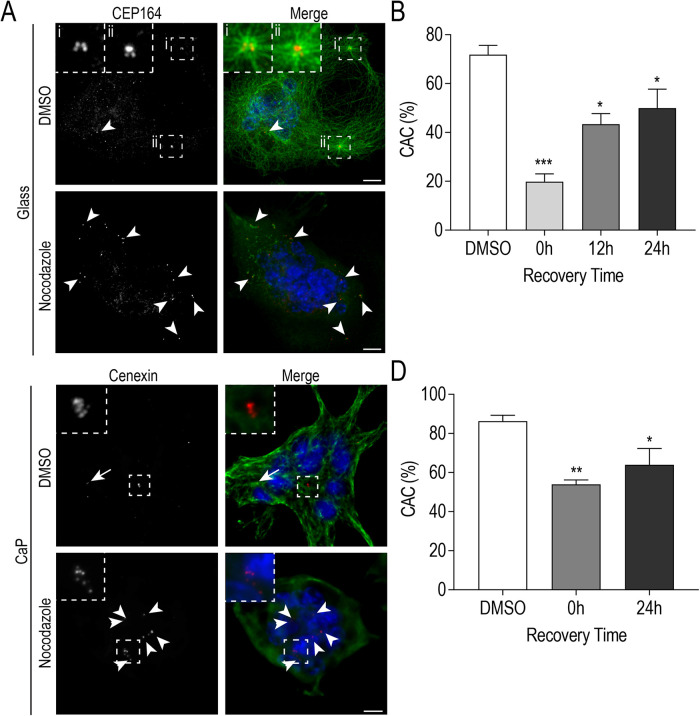
Centrosome clustering is maintained by an established MT network. (A) Representative images of fixed RAW-derived osteoclasts after nocodazole-induced MT depolymerization (5 min recovery) cultured on glass (C) Representative images of fixed RAW-derived osteoclasts after nocodazole-induced MT depolymerization (0 min recovery) replated on CaP substrate. Cells were stained with DAPI (blue), tubulin (green), and CEP164 or cenexin (red). White arrows indicate centrosome pairs and arrowheads indicate lone centrosomes. Centrosome clusters are shown in dashed box insets. Scale bars = 10 μm. (B and D) Quantification of centrosome clustering (%) for osteoclasts cultured on glass (B; n = 60) or CaP substrate (D; n = 34) at indicated time points post-MT regrowth from three independent experiments. Significance relative to DMSO was determined via a one-way ANOVA followed by Dunnett’s multiple comparison (*P < 0.05; **P < 0.01; ***P < 0.001).

