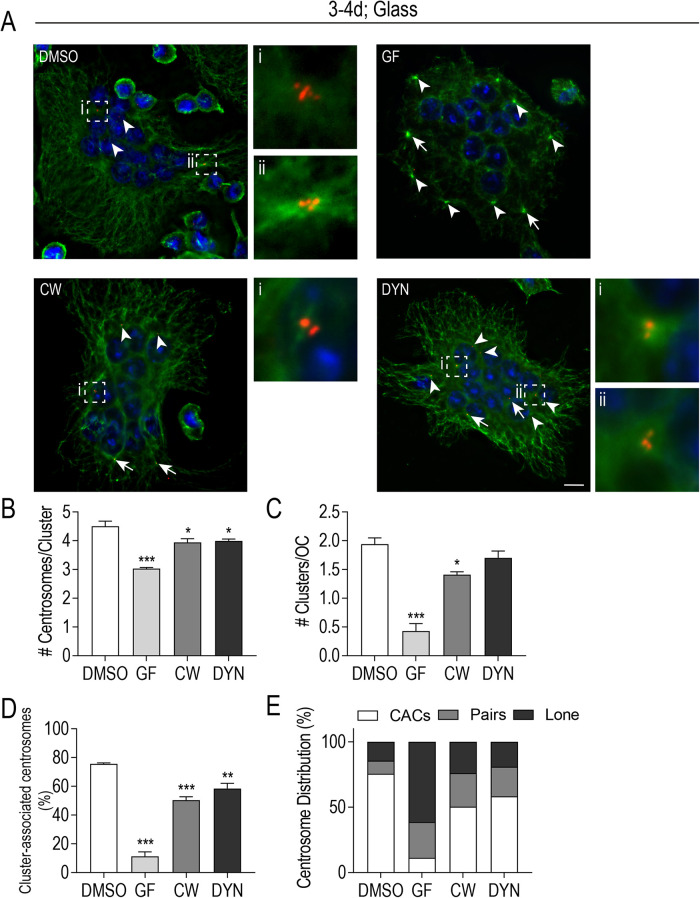
FIGURE 6:
MT dynamicity, KIFC1, and dynein activity contribute to centrosome clustering in osteoclasts. (A) Representative images of fixed, glass-plated RAW-derived osteoclasts after treatment with centrosome declustering agents: 40 μM GF, 80 μM CW069 (CW), and 175 μM DYN. Cells were fixed 24 h posttreatment and stained with DAPI (blue), tubulin (green), and cenexin (red). White arrows indicate centrosome pairs and arrowheads indicate lone centrosomes. Centrosome clusters are shown in dashed box insets. Scale bars = 10 μm. (B and C) The average number of centrosomes per cluster (B) and the average number of clusters/cell (C) after treatment with declustering drugs was calculated from four independent experiments (n = 60). Significance relative to DMSO was determined through a one-way ANOVA followed by Dunnett’s multiple comparison (*P < 0.05; ***P < 0.001) (D) The % cluster-associated centrosomes after treatment with individual declustering drugs from four independent experiments. Significance relative to DMSO was determined through a one-way ANOVA followed by Dunnett’s multiple comparison (**P < 0.01; ***P < 0.001). Each graph displays mean ± SEM (B–D). (E) Centrosome distribution (%) in clusters, pairs, or individually after treatment with individual declustering drugs from four independent experiments.

