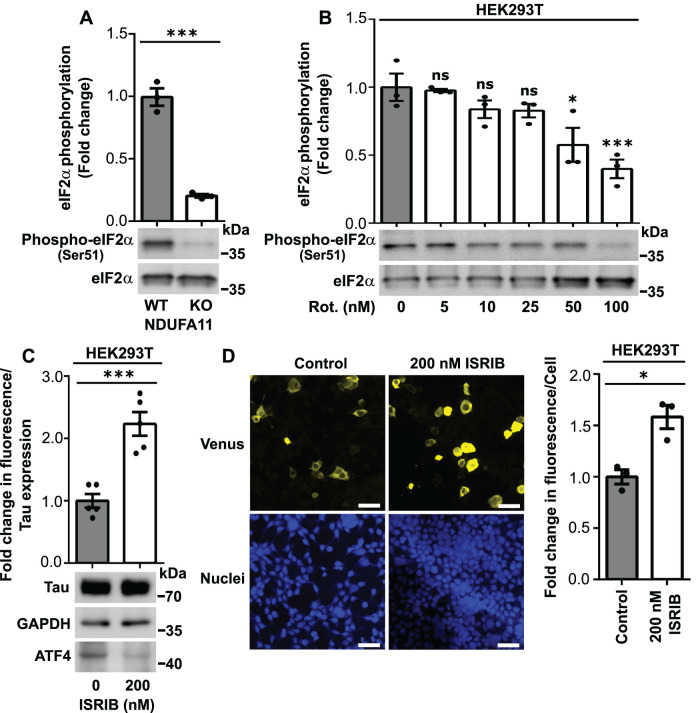
FIGURE 3:
HEK293T cells that were treated with ISRIB exhibited Tau dimerization. (A) Phosphorylation of eIF2α (Ser-51) in HEK293T wild-type cells and HEK293T NDUFA11 knockout cells. The data are expressed as mean ± SEM. n = 3. (B) Phosphorylation of eIF2α (Ser-51) in HEK293T cells that were treated for 48 h with rotenone. The data are expressed as mean ± SEM. n = 3. (C) Fold change in Venus fluorescence normalized to the level of Tau expression in HEK293T control cells and HEK293T cells that were treated with ISRIB for 68 h as indicated. The data are expressed as mean ± SEM. n = 5. (D) Increase in Venus fluorescence in HEK293T cells that were treated with ISRIB for 68 h as indicated. Nuclei were stained with DAPI. Scale bar = 50 μm. The graph shows the quantification of fold changes in mean Venus fluorescence per cell in the confocal microscopy experiments. n = 3. Rot., rotenone. *p < 0.05, ***p < 0.001; ns, not significant (p > 0.05) (Student’s t test or one-way ANOVA followed by Dunnett’s multiple comparisons test in B).

