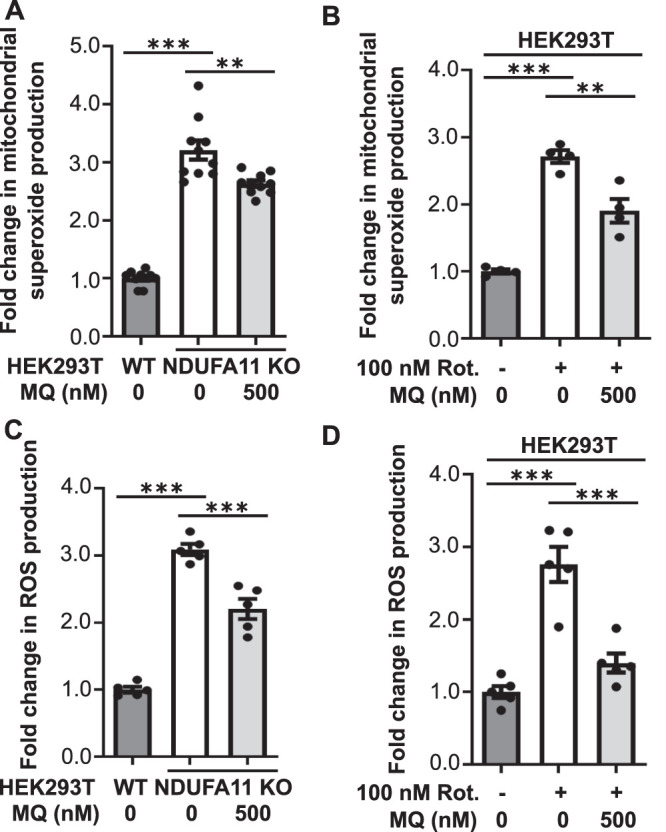
FIGURE 7:

MitoQ attenuated the increase in ROS production in cells with prolonged mitochondrial dysfunction. (A) Mitochondrial superoxide production measured with MitoSOX in HEK293T NDUFA11 knockout cells and in the presence of MitoQ (24 h) as indicated. The data are expressed as mean ± SEM. n = 10. (B) Mitochondrial superoxide production measured with MitoSOX in HEK293T cells that were treated with rotenone for 68 h and in the presence of MitoQ (24 h) as indicated. The data are expressed as mean ± SEM. n = 4. (C) ROS production measured with CM-H2DCFDA in HEK293T NDUFA11 knockout cells and in the presence of MitoQ (24 h) as indicated. The data are expressed as mean ± SEM. n = 5. (D) ROS production measured with CM-H2DCFDA in HEK293T cells that were treated with rotenone for 68 h and in the presence of MitoQ (24 h) as indicated. The data are expressed as mean ± SEM. n = 5. MQ, MitoQ; Rot., rotenone; ROS, reactive oxygen species. **p < 0.01, ***p < 0.001 (one-way ANOVA followed by Tukey’s multiple comparisons test).
