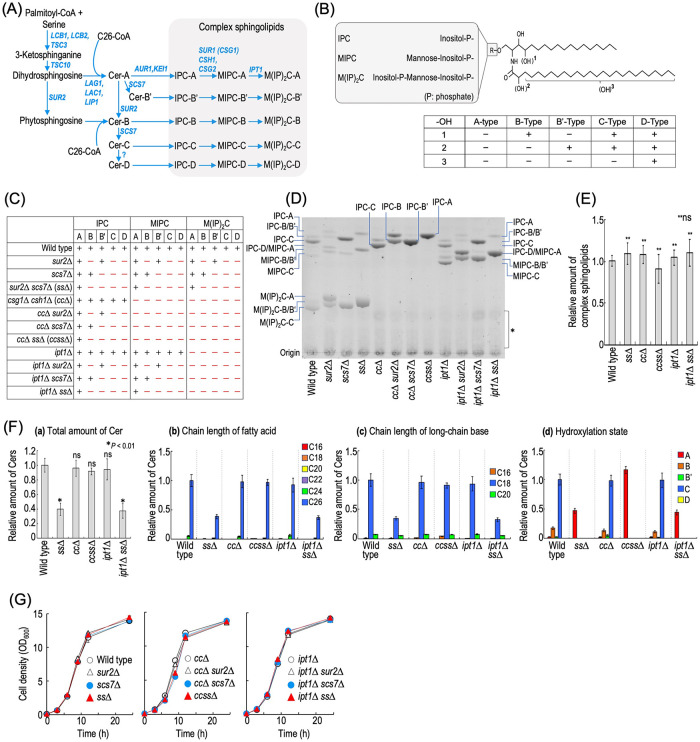
FIGURE 1:
Construction of a complex sphingolipid structural diversity disruption library. (A) Complex sphingolipid biosynthesis pathway in budding yeast S. cerevisiae. The pathway and genes responsible for the synthesis of complex sphingolipids in S. cerevisiae are shown. Owing to the different hydrophilic head groups and hydroxylation states of the ceramide (Cer) moiety, 15 subtypes of complex sphingolipid can be synthesized. For convenience, SUR1 encoding MIPC synthase is called CSG1 in this study. (B) Structure of S. cerevisiae complex sphingolipids. S. cerevisiae complex sphingolipids have three types of hydrophilic head group. Hydroxylation sites in the Cer moiety are labeled 1, 2, and 3. Sites 1 (the C-4 position of LCBs) and 2 (the C-2 position in fatty acids) are hydroxylated by Sur2 and Scs7, respectively. Site 3 is at an unknown position on the fatty acids, and the enzyme involved in the hydroxylation has not yet been identified. Owing to the difference in hydroxylation state, the Cer moiety of complex sphingolipids is classified into the A, B, B′, C, and D types. (C) The structural diversity of complex sphingolipid-disrupted mutants used in this study. A plus symbol indicates a subtype of complex sphingolipids that can be synthesized in each type of mutant cells. (D) TLC analysis of the mutant cells. Cells were cultured overnight in YPD medium, diluted (0.3 OD600 units/ml) in fresh YPD medium, and then incubated for 5 h at 30°C. Lipids were extracted, subjected to mild alkaline treatment, separated by TLC, and then visualized with a copper sulfate and orthophosphoric acid reagent. The asterisk indicates unidentified bands. (E) Amounts of complex sphingolipids in wild-type (MTY174), sur2∆ scs7∆ (ss∆), csg1∆ csh1∆ (cc∆), csg1∆ csh1∆ sur2∆ scs7∆ (ccss∆), ipt1∆, and ipt1∆ sur2∆ scs7∆ (ipt1∆ ss∆) cells. TLC analysis was performed as described in D. The amount of complex sphingolipids (IPCs, MIPCs, and M(IP)2Cs) in wild-type cells was taken as 1. (F) Analysis of free Cers by LC-ESI MS/MS. Cells were cultured, and lipids were extracted as described in D. Cers were measured by the MRM mode constructed by the combination of LCBs and fatty acids with different chain lengths or hydroxylation states. The total amount of Cers (panel a), carbon chain lengths of the fatty acid moieties (panel b), carbon chain lengths of the LCB moieties (panel c), and hydroxylation state of Cers (panel d) are shown. (G) Time course of cell growth. Cells were cultured overnight in YPD medium at 30°C and diluted (0.1 OD600 units/ml) in fresh YPD medium, and then aliquots of the cell suspensions were subjected to cell density measurements (OD600) at the indicated times. Data represent means ± SD for one experiment (triplicate) representative of three independent experiments. ns: no significant difference. The details are given in Materials and Methods.

