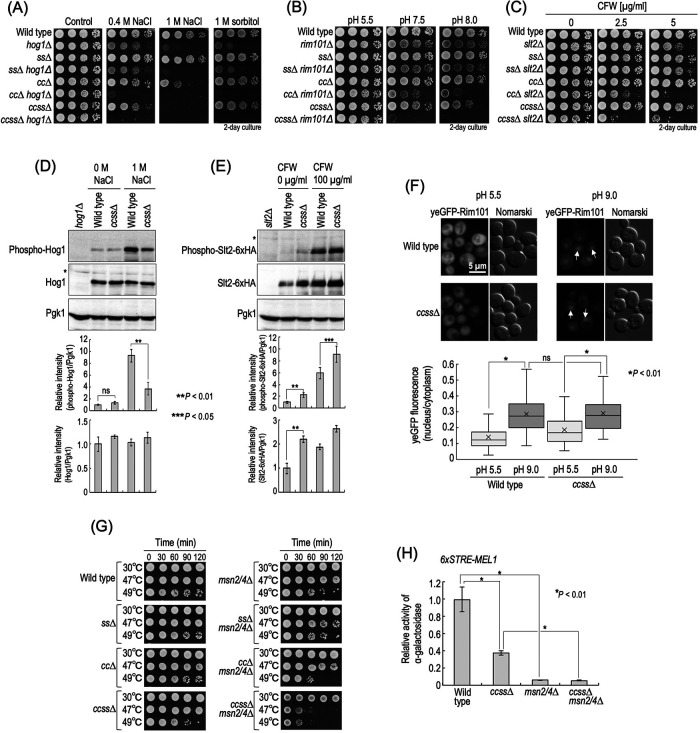
FIGURE 4:
Relationship between stress sensitivity of complex sphingolipid diversity–disrupted mutants and stress response systems. (A–C) Cells cultured overnight in YPD medium at 30°C were spotted onto YPD plates containing 0.4 or 1 M NaCl, 2 M sorbitol (A) or 2.5 or 5 µg/ml CFW (C) and then incubated for 2 d. Buffered YPD plates were prepared by the addition of 50 mM MES and MOPS (for pH 5.5) or 100 mM HEPES (for pH 7.5 and 8.0) (B). (D) Western blotting analysis of phosphorylation of Hog1. Cells were cultured overnight in YPD medium, diluted (0.1 OD600 units/ml) in fresh YPD medium, and then incubated for 5 h at 30°C. Then, cells were treated with 1 M NaCl (final concentration) for 20 min by the addition of fresh YPD containing 5 M NaCl to the culture medium. For the control experiment (0 M NaCl), an equal volume of fresh YPD medium was added to the culture medium. Yeast cell extracts were immunoblotted using anti–phospho-p38 MAPK (recognizes phospho-Hog1), anti-Hog1, or anti-Pgk1. The relative amount of phospho-Hog1/Pgk1 or phospho-Hog1/Hog1 in wild-type cells without NaCl was taken as 1. (E) Western blotting analysis of phosphorylation of Slt2-6xHA. Cells expressing Slt2-6xHA were precultured as described in D. Then, cells were treated with 100 µg/ml CFW for 30 min. Yeast cell extracts were immunoblotted using anti–phospho-p44/42 MAPK (recognizes phospho-Slt2-6xHA), anti-HA, or anti-Pgk1. The relative amount of phospho-Slt2-6xHA/Pgk1 or Slt2-6xHA/Pgk1 in wild-type cells without CFW was taken as 1. Data represent means ± SD for one experiment (triplicate) representative of three independent experiments. The asterisk indicates unidentified bands. (F) Translocation of yeGFP-Rim101. Cells expressing yeGFP-Rim101 were cultured overnight in YPD medium, diluted (0.1 OD600 units/ml) in fresh YPD medium, and then incubated for 4 h at 30°C. For alkaline treatment to activate the Rim101 pathway, Tris-HCl (pH 9.0) was added to the culture medium at a final concentration of 100 mM. For the control experiment, MES and MOPS (pH 5.5) were added at a final concentration of 50 mM. Cells were incubated for 60 min at 30°C, fixed, and then viewed under a fluorescence microscope. The arrows indicate nuclear localization of yeGFP-Rim101. The ratio of yeGFP fluorescence in cytoplasm and the nucleus in individual cells is expressed as a boxplot. Data represent the values for 100 cells for individual strains. (G) Heat stability. Cells (0.7 OD600 units) grown in YPD medium were collected by centrifugation, washed with water, and then suspended in 1 ml of water. The cell suspensions were incubated for the indicated times at the indicated temperatures, and samples (3.5 µl) were spotted onto YPD plates and then incubated for 2 d. (H) STRE-mediated transcriptional activity. Cells harboring pRS416-6xSTRE-MEL1 were cultured overnight in SC medium lacking uracil (SC–Ura), diluted (0.3 OD600 units/ml) in fresh SC–Ura medium, and then incubated for 6 h at 30°C. Cells were harvested, and α-galactosidase activity was measured. Data represent means ± SD for one experiment (triplicate) representative of three independent experiments. ns: no significant difference. The details are given in Materials and Methods.

