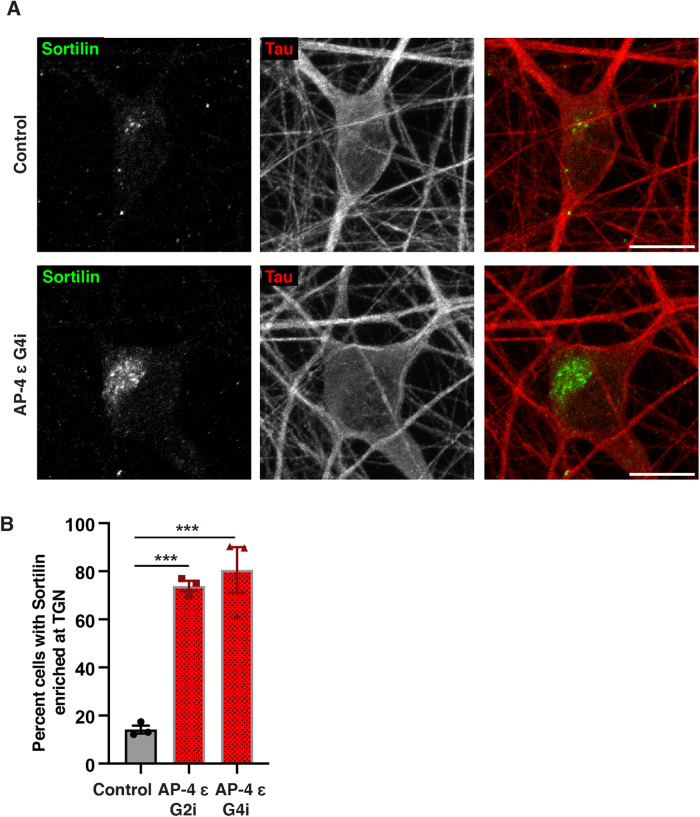
FIGURE 3:
Sortilin distribution is dramatically altered in AP-4 i3Neurons. (A) Representative images of Control and AP-4 G4i i3Neurons stained for Sortilin (green) and Tau (red), showing Sortilin is strongly accumulated in the TGN area in soma of AP-4 i3Neurons. Bar, 10 μm. (B) Quantification of the percentage of AP-4 i3Neurons with Sortilin accumulation in the TGN area compared with Control i3Neurons (42 DIV; mean ± SEM from three independent experiments; >100 neurons per genotype; ***P < 0.001).

