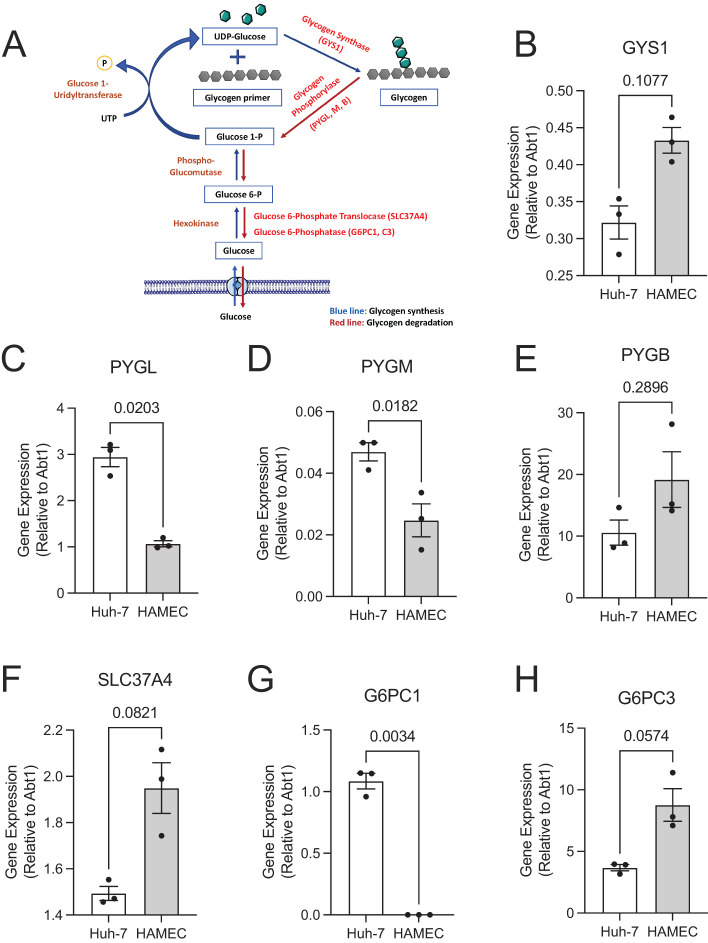
FIGURE 3:
HAMEC express key glycogen metabolism enzymes. (A) Shown is a schematic metabolic pathway outlining the synthesis (blue arrows) and breakdown (red arrows) of glycogen. (B–H) Expression of enzymes indicated in red font, A were quantified in human Huh-7 liver cells or HAMEC by qPCR with TaqMan probes using the ΔΔCt method compared with the ABT1 reference gene (n = 3 experiments, in duplicate, indicated p-values calculated using Student’s paired t test, two-tailed). Shown are the relative mean ± SEM mRNA expression for GYS1, B; PYGL, C; PYGM, D; PYGB, E; SLC37A4, F; G6PC1, G; and G6PC3, H. GYS = glycogen synthase, PYG = glycogen phosphorylase (liver brain, muscle isoforms: L, B, M), SLC37A4 = glucose-6-phosphate translocase, G6PC = glucose-6-phosphate phosphatase catalytic subunit.

