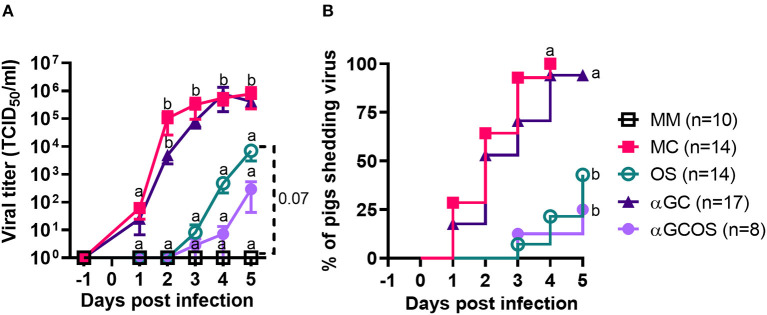
Figure 1.
Virus levels in nasal secretions. (A) Virus titers in nasal swabs collected at −1 to 5 d.p.i. from pigs inoculated with H1N1pdm09. Data are represented as mean ± standard error of the mean (SEM). Values within days with no common superscript letters differ significantly (P < 0.05) when analyzed using Tukey's test. Values with the same superscript are not statistically different. (B) Incidence of pigs shedding virus. Survival curves with no common superscript letters differ significantly (P < 0.05) when compared by the log-rank test. Survival curves with the same superscript are not statistically different.

