Figure 3.

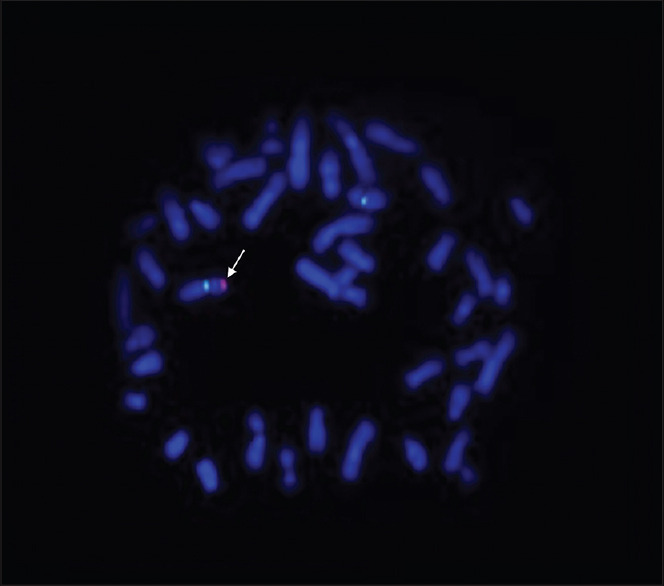
FISH analysis showed 2 green signals (X centromere) and 1 red signal (SRY gene - arrow) onto an X chromosome. FISH = Fluorescent in situ hybridization

FISH analysis showed 2 green signals (X centromere) and 1 red signal (SRY gene - arrow) onto an X chromosome. FISH = Fluorescent in situ hybridization