
FIGURE 4.
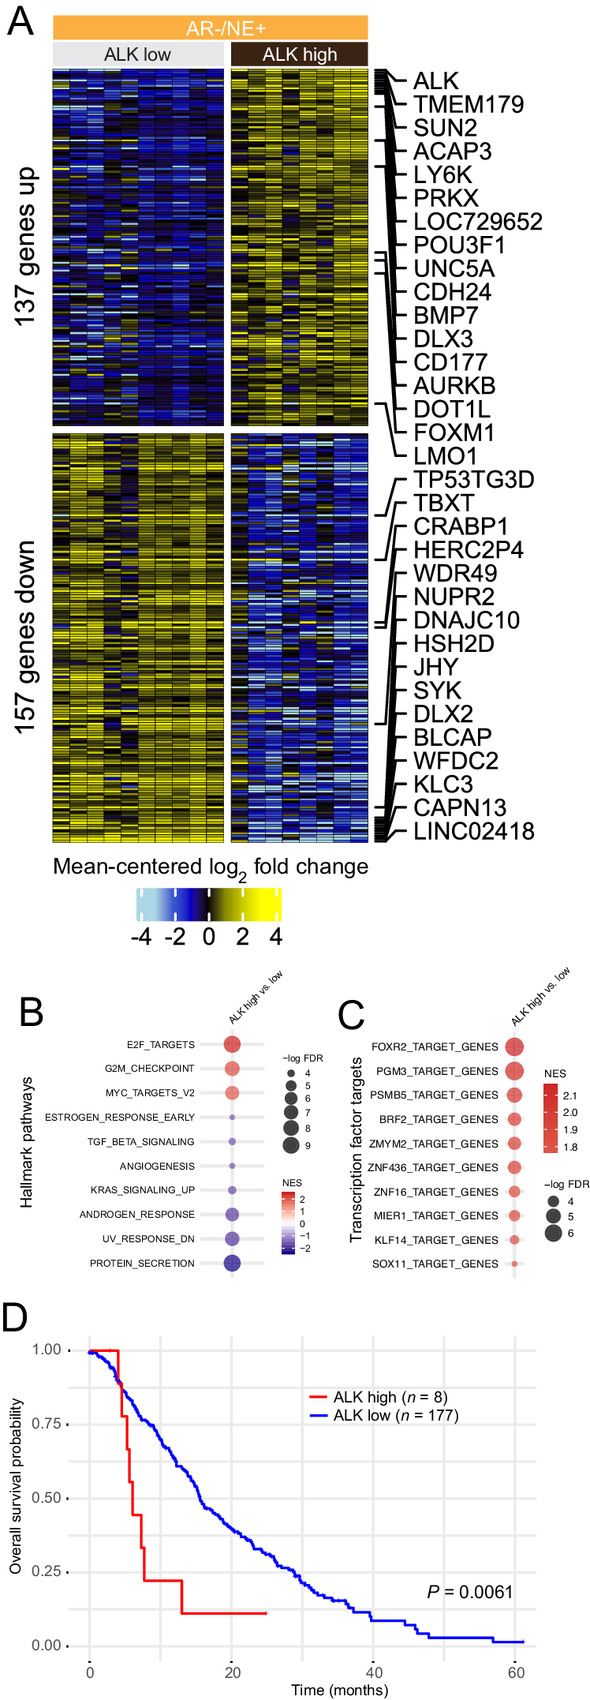
ALK overexpression is associated with distinct transcriptional changes in NEPC. A, Heatmap depicting expression differences between 10 tumors of the UW rapid autopsy cohort with low/no ALK expression and eight tumors with high ALK expression. Shown are mean centered log2 fold changes for 137 upregulated and 157 downregulated genes with FDR<0.05. B, Gene-set enrichment analysis for Hallmark Pathway gene sets show distinct expression differences in pathways involved in cellular proliferation and MYC signaling. C, Trans-cription factor signature enriched in ALK-overexpressing tumors. All pathways shown have enrichment FDR < 0.05. D, Kaplan–Meier survival plot shows shortened overall survival of patients with high ALK mRNA expression in the Stand Up to Cancer International Dream Team cohort.