. 2022 Nov 4;130(11):117003. doi: 10.1289/EHP11360

Figure 13.

Figures 13A to 13C are horizontal bar graphs titled control, inulin, pectin, plotting g underscore Alistipes, g underscore Oscillibacter, g underscore Flavonifractor, g underscore Flintibacter, g underscore Dysosmobacter, g underscore Paenibacillus, g underscore Citrobacter, g underscore Intestinimonas, g underscore Acutalibacter, g underscore Streptomyces, g underscore Turicimonas, g underscore Olsenella, g underscore Micromonospora, g underscore Christensenella, g underscore Corynebacterium, g underscore Caproiciproducens, g underscore Ruminococcus, g underscore Flavobacterium, g underscore Mucilaginibacter, g underscore Chryseobacterium, g underscore Alloprevotella, g underscore Porphyromonas, g underscore Tannerella, g underscore Barnesiella, g underscore Sodaliphilus, g underscore Prevotella, g underscore Muribaculum, and g underscore Duncaniella; g underscore Faecalitalea, g underscore Ruminococcus, g underscore Streptomyces, g underscore Dysosmobacter, and g underscore Flavonifractor; and g underscore Paraprevotella and g underscore Staphylococcus (y-axis) across Linear discriminant analysis score, ranging from negative 5 to 5 in increments of 2 (x-axis) for P F O S and vehicle, respectively.

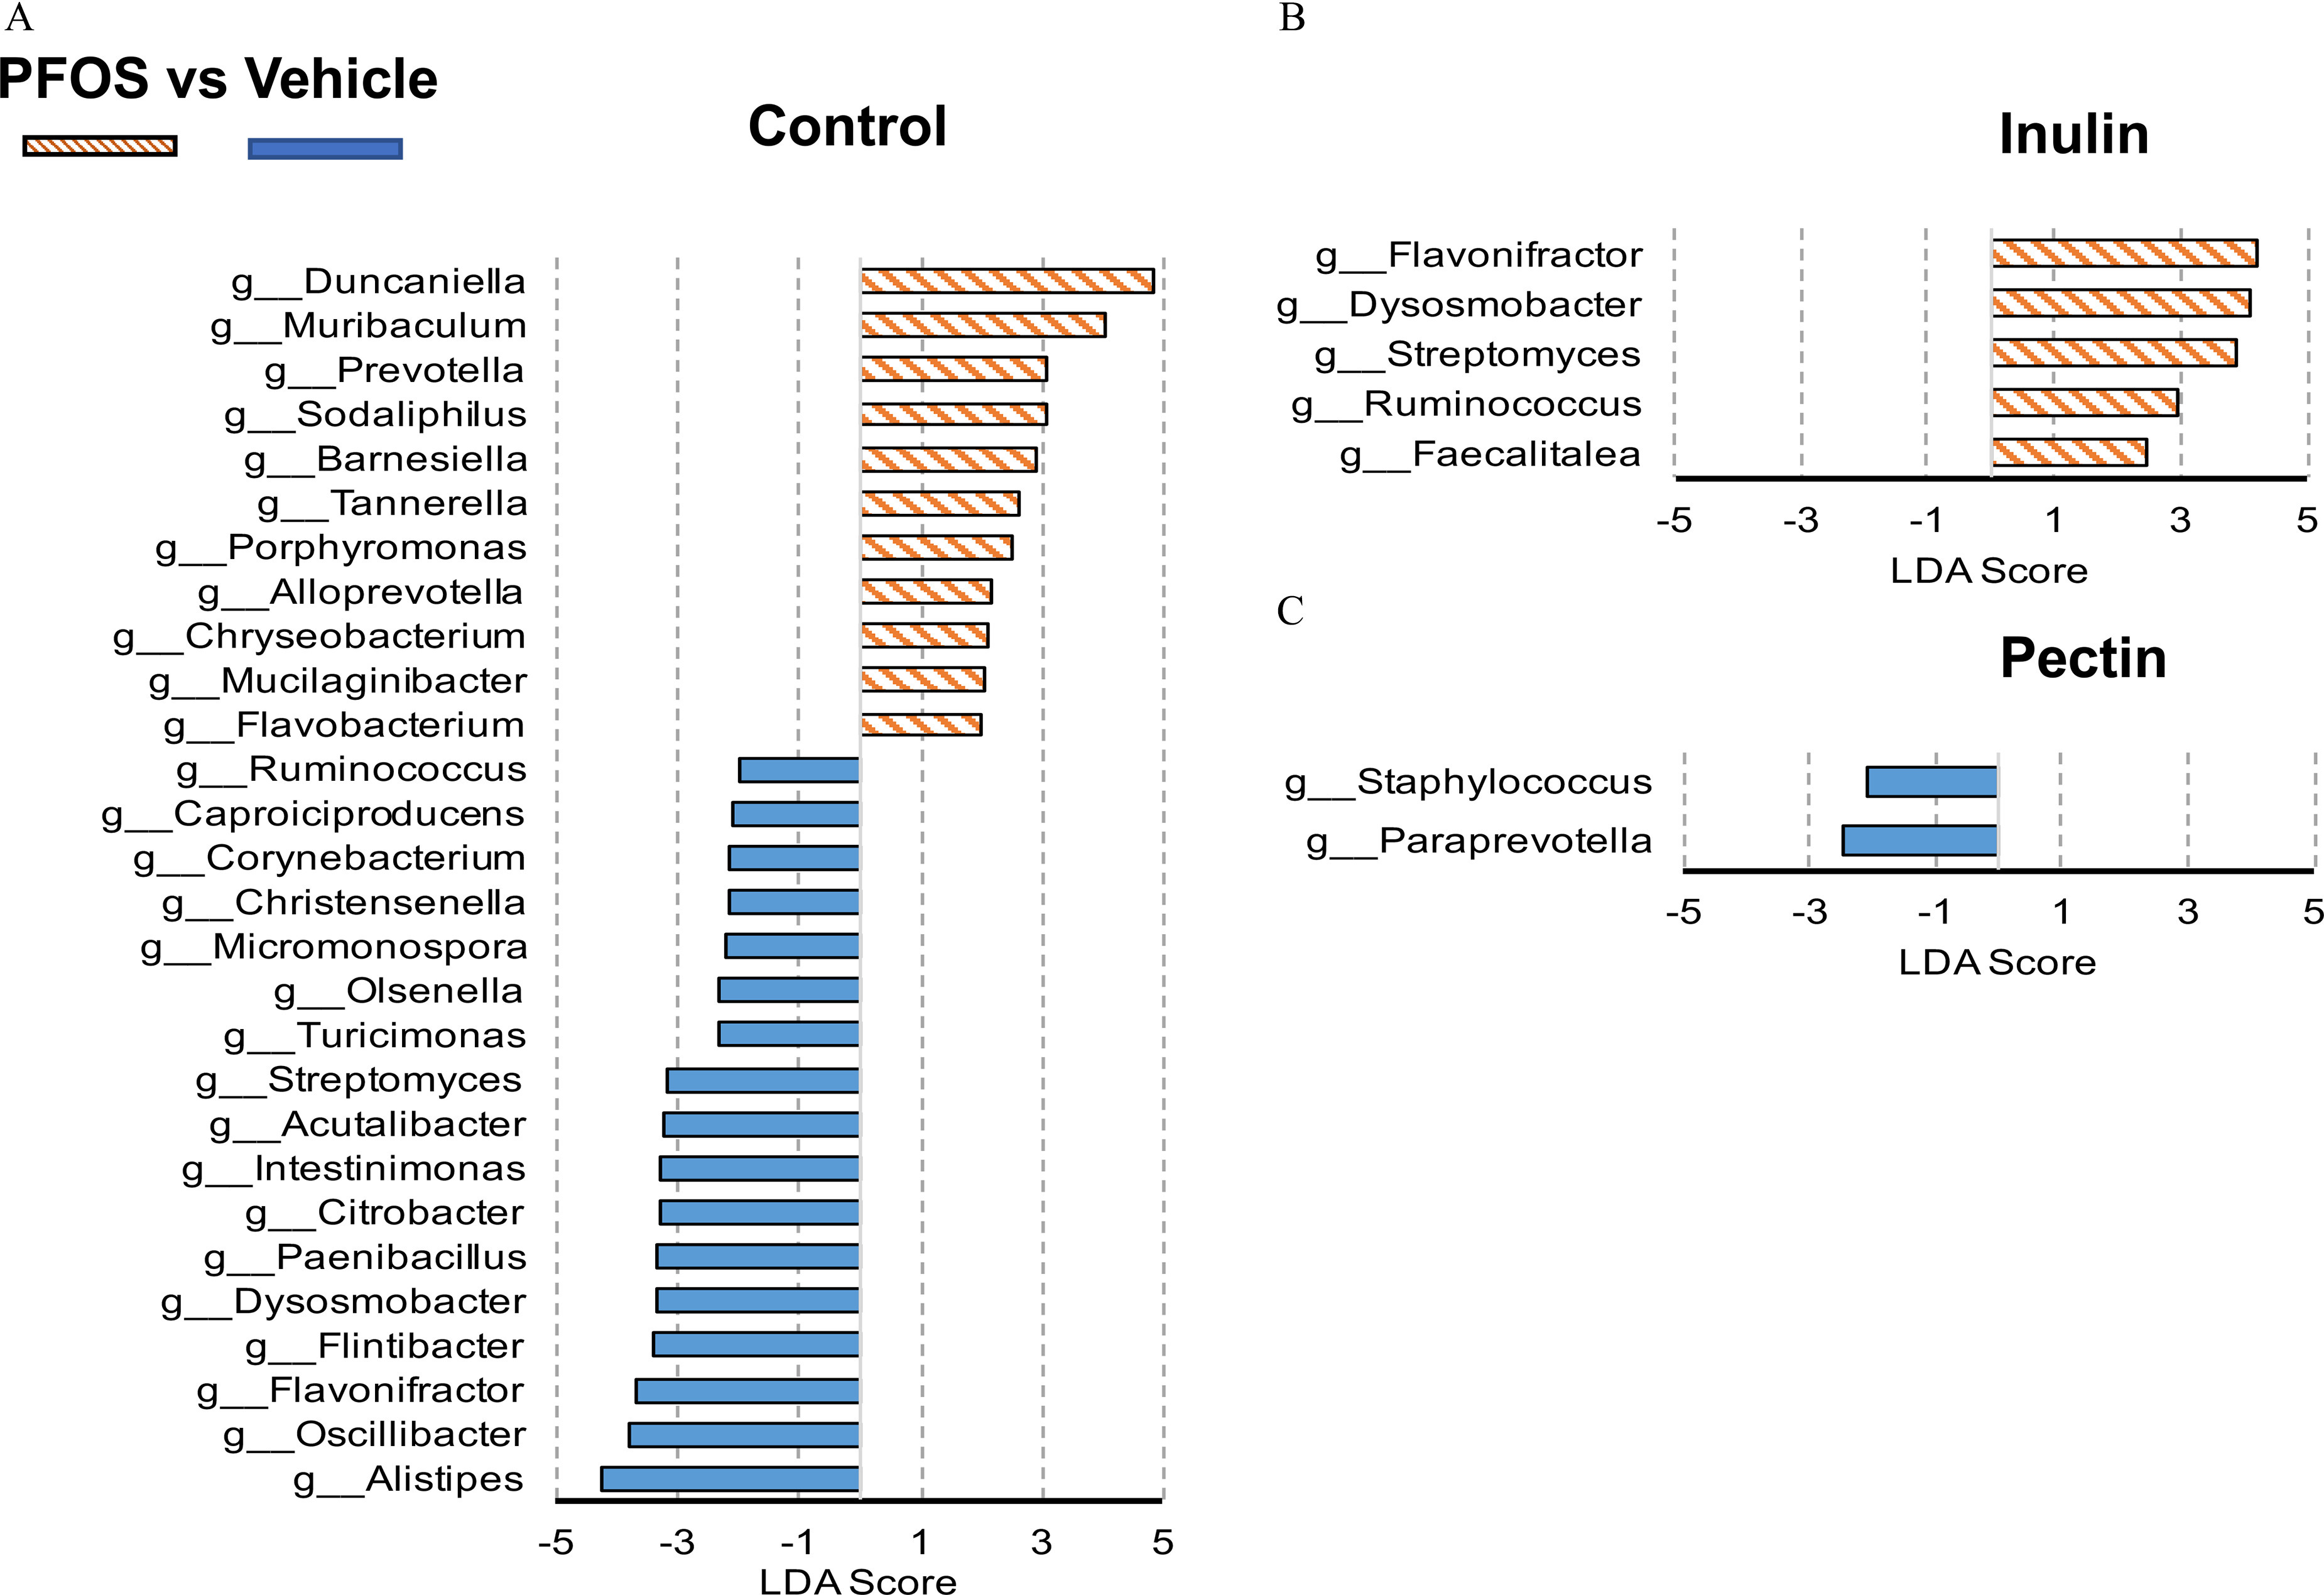
Linear discriminant analysis (LDA) scores of differentially abundant taxa in cecal content between the PFOS- and vehicle-treated mice fed the (A) control diet, (B) inulin diet, or (C) pectin diet using the linear discriminant analysis effect size method. Only taxa meeting an LDA significant threshold of 2 and p<0.05 are shown. The mice were fed with a diet supplemented with dietary fibers. Detailed LDA score data are listed in Excel Table S18. Note: PFOS, perfluorooctane sulfonate.