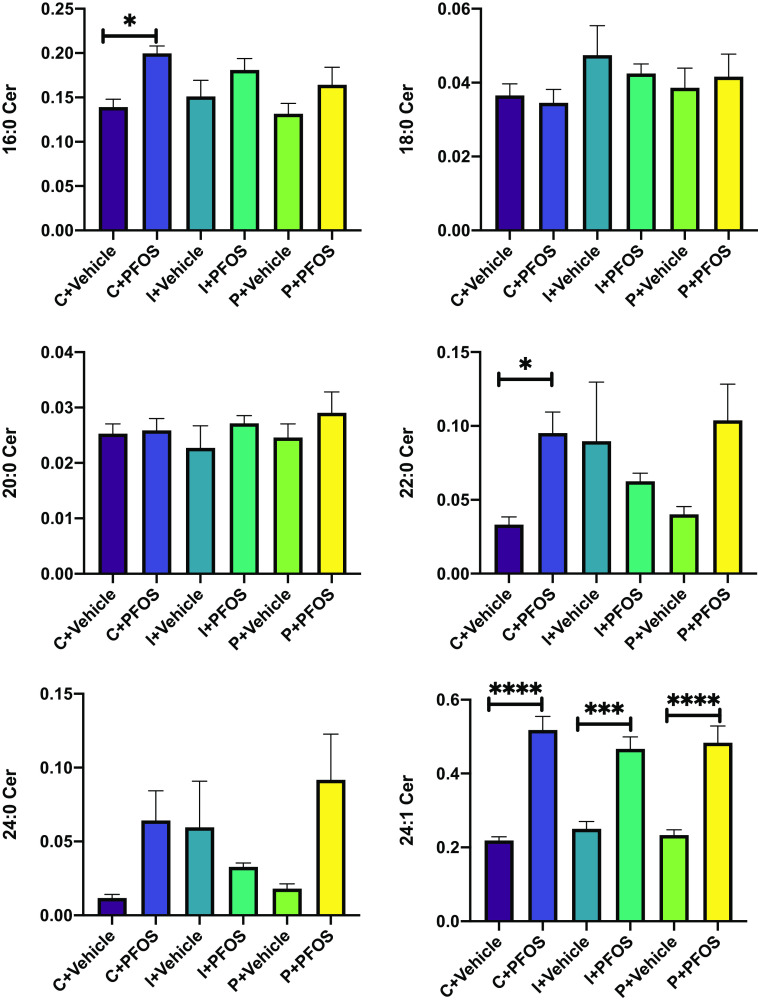
Figure 3.
Liver ceramide levels in mice exposed to PFOS and fed diets supplemented with different fibers (C: cellulose as control, I: inulin, P: pectin). Ceramides were analyzed using UHPLC-Q Exactive MS. Bars represent of 6–8 mice in each group. Data were compared using two-way ANOVA and Tukey test for multiple comparisons, *; **; ***; and ****. Detailed ceramide data are listed in Excel Table S12. Note: ANOVA, analysis of variance; PFOS, perfluorooctane sulfonate; SEM, standard error of the mean; UHPLC-Q exactive MS, ultra-high-performance liquid chromatography coupled with quadrupole-exactive mass spectrometer.

