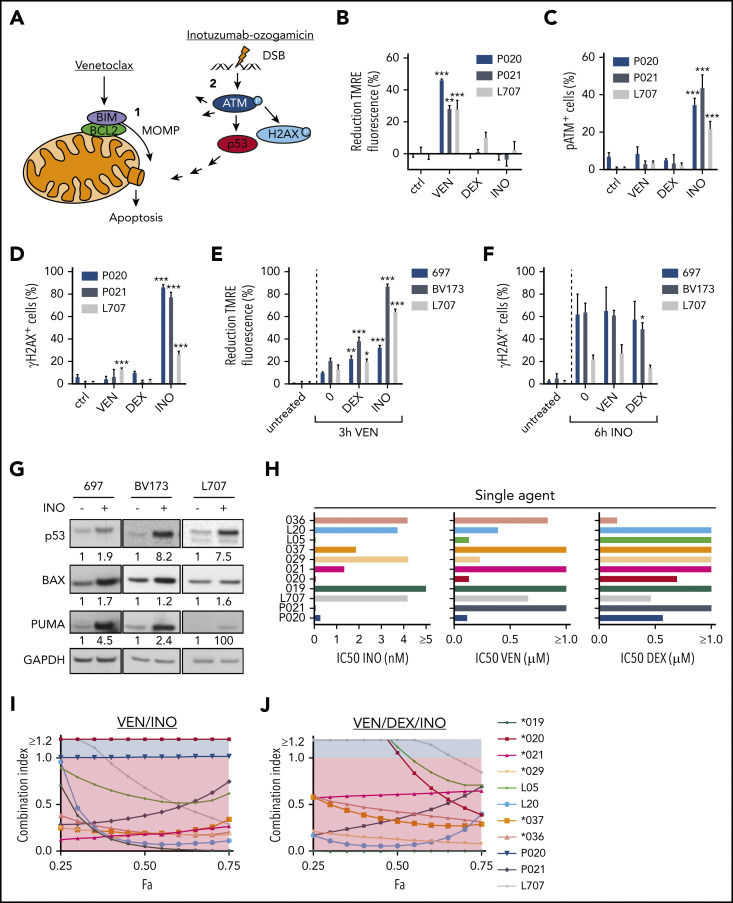
Figure 1.
Induction of apoptosis in ALL cells by venetoclax (VEN), dexamethasone (DEX), and inotuzumab ozogamicin (INO). (A) Model of apoptosis induction by venetoclax and inotuzumab ozogamicin. Venetoclax directly induces MOMP by interrupting protein-protein interactions of anti- and proapoptotic proteins BCL2 and BIM. Release of BIM results in pore formation and subsequent apoptosis. Inotuzumab ozogamicin induces DSBs, which leads to phosphorylation of ATM kinase. ATM in turn phosphorylates H2AX and activates p53 signaling. (B-D) Mode of action of venetoclax and inotuzumab ozogamicin. P020, P021, and L707 PDX cells were treated with venetoclax (P020, 50 nM; P021, 1000 nM; L707, 250 nM), dexamethasone (P020, 1 µM; P021, 5 µM; L707, 1 µM), or inotuzumab ozogamicin (P020, 100 ng/mL; P021, 100 ng/mL; L707, 1000 ng/mL), respectively. Error bars indicate ± standard deviation (n = 3). (B) After 3 hours of treatment, cells were stained with tetramethylrhodamine ethyl ester (TMRE) to determine MOMP of viable cells by flow cytometry. Treatment with the carbonyl cyanide 4-(trifluoromethoxy)phenylhydrazone (FCCP) ionophore served as positive control. Reduction of TMRE fluorescence of untreated cells was set as 0%. After 6 hours of treatment, cells were fixed, permeabilized, and stained with an antibody to (C) pATM or (D) γH2AX. (E) MOMP induction by venetoclax with or without pretreatment for 24 hours with dexamethasone (L707, 2 µM; 697, 5 µM; BV173, 200 nM) or inotuzumab ozogamicin (L707, 500 ng/mL; 697, 20 ng/mL; BV173, 20 ng/mL). After 3 hours of treatment, cells were stained with 50 nM TMRE to determine MOMP induction by flow cytometry. FCCP served as a positive control. Reduction of TMRE fluorescence of untreated cells was set as 0%. (F) γH2AX induction by inotuzumab ozogamicin in L707, 697, and BV173 cells with or without pretreatment for 24 hours with dexamethasone (L707, 5 µM; 697, 5 µM; BV173, 1 µM) or venetoclax (L707, 100 nM; 697, 250 nM; BV173, 250 nM). After 6 hours of treatment with inotuzumab ozogamicin (L707, 500 ng/mL; 697 and BV173, 100 ng/mL), cells were fixed, permeabilized, and stained with an antibody to γH2AX. (G) Western blot analysis for p53, BAX, and PUMA expression of L707, 697, and BV173 cells treated with 20, 2.5, or 1 ng/mL inotuzumab ozogamicin for 24 hours, respectively. Glyceraldehyde-3-phosphate dehydrogenase (GAPDH) served as loading control. Western blots are representative of 3 independent experiments. (H-J) Primary ALL samples and PDX cells were treated with inotuzumab ozogamicin, venetoclax, and dexamethasone alone or in combination in fixed ratios for 48 hours followed by CD19 antibody and propidium iodide staining. (H) IC50’s of inotuzumab ozogamicin, venetoclax, and dexamethasone were determined by CompuSyn software. (I-J) Fraction affected (Fa)/CI plots for drug combinations of venetoclax-inotuzumab ozogamicin (I) and venetoclax-dexamethasone-inotuzumab ozogamicin (J). CIs were calculated using CompuSyn software. CI <1 was considered synergistic. P values were calculated by 1-way analysis of variance (ANOVA) with Bonferroni correction. *P < .05; **P < .01; ***P < .001. ctrl, control.

