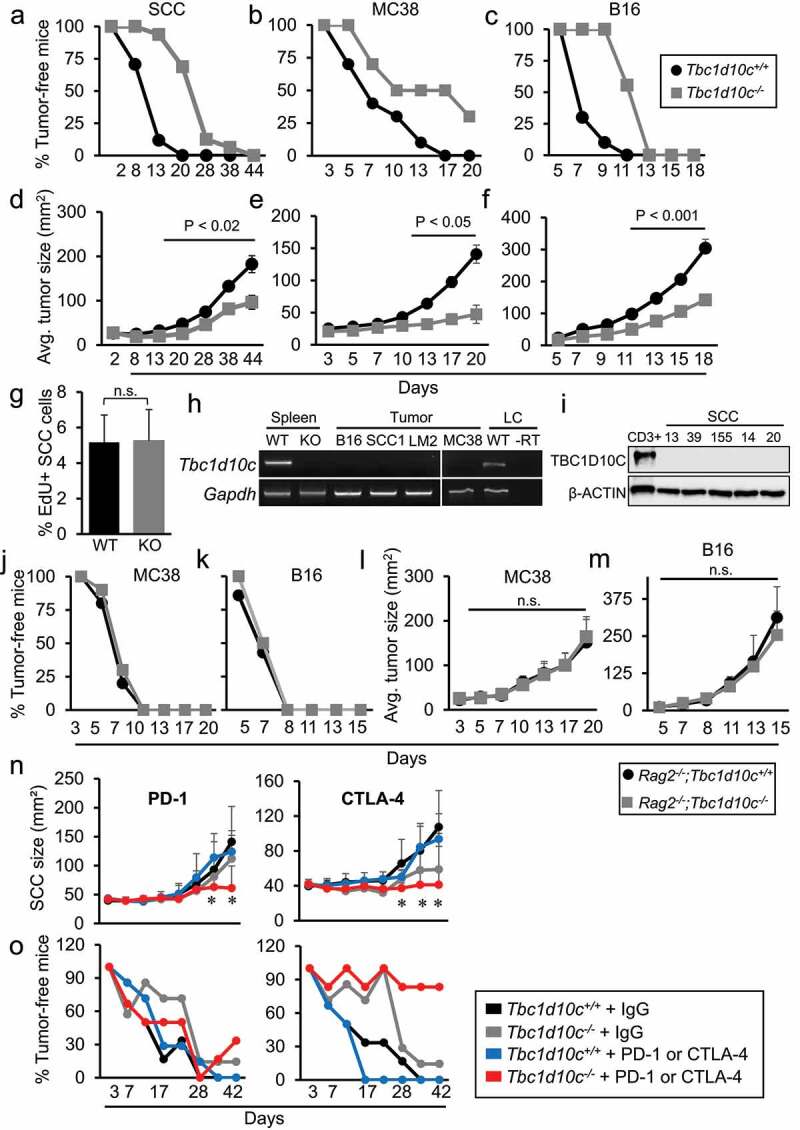
Figure 1.

T-cell-mediated tumor resistance conferred by Tbc1d10c deficiency. (A-C) Line graphs showing percentages of tumor-free survival in mice implanted with SCC (A), MC38 (B) and B16 (C) tumors. (D-F) Line graphs showing average tumor size in SCC (D; n = 17 Tbc1d10c+/+ mice and 16 Tbc1d10c−/− mice), MC38 (E; n = 10 mice per group), and B16 (F; n = 10 Tbc1d10c+/+ mice and 9 Tbc1d10c−/− mice) orthotopic mice. (G) Bar graph showing percentages of EdU+ tumor cells in orthotopic SCCs in Tbc1d10c+/+ and Tbc1d10c−/− mice (n = 7 per group). (H) Micrographs showing representative RT-PCR detection of Tbc1d10c mRNA in Tbc1d10c+/+ and Tbc1d10c−/− spleen; SCC1, LungMet2 (LM2), B16 and MC38 tumor cell lines; and splenic lymphocytes (LC). (I) Micrographs showing immunoblot detection of TBC1D10C in human CD3+ PBMCs (positive control) and five independent human SCC cultures SCC13, 39, 155, 14 and 20. µ-ACTIN serves as a loading control. (J-M) Line graphs showing percentage of tumor-free survival (J-K) and average tumor size (L-M) in Rag2−/−;Tbc1d10c+/+ and Rag2−/−;Tbc1d10c−/− mice subjected to MC38 (J,L) (n = 10 per group) or B16 (K,M) (n = 7 per group) xenografts. (N-O) Line graphs showing average SCC size (N) and percentage of tumor-free survival (O) in Tbc1d10c+/+and Tbc1d10c−/− mice receiving injections of PD-1, CTLA-4 or IgG control antibodies at days 3, 6 and 9 following SCC cell implantation (n = 7 mice per group). Statistical differences were determined by one-way ANOVA with Bonferroni post-hoc correction (*, P < .05). All other P values were determined by unpaired Student’s t-test. Abbreviations: WT, Tbc1d10c+/+; KO, Tbc1d10c−/−; RT, reverse transcriptase.
