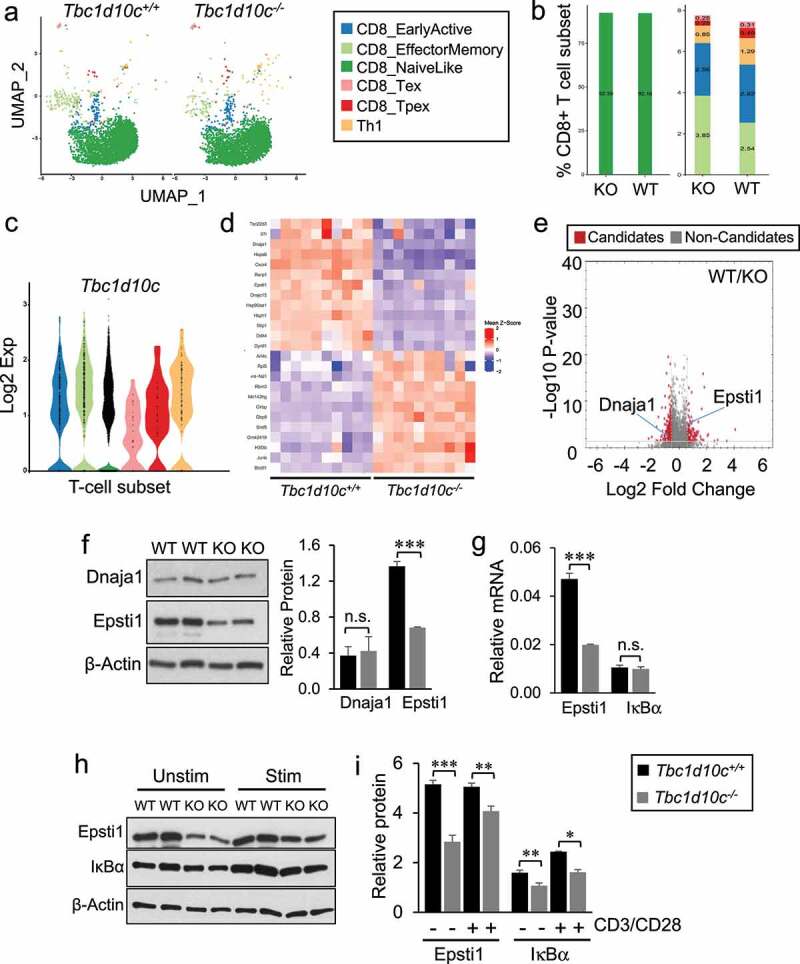
Figure 4.

Single-cell RNA sequencing and dual LC-MS/MS proteomic profiling in Tbc1d10c−/− CD8 T cells. (A) Two-dimensional uniform manifold approximation and projection (UMAP) visualization of CD8 T-cell subsets generated by ProjecTILs analysis (cells were projected to the mouse reference TIL atlas) of scRNA-seq Tbc1d10c+/+ and Tbc1d10c−/− data sets. Each point represents a single cell and T-cell subsets are color-coded (middle box). (B) Bar plots comparing the quantified percentages of naïve-like (left) and memory, early active and Th1 (right) CD8 T-cell subsets, according to the ProjecTILs analysis, between Tbc1d10c+/+ and Tbc1d10c−/− cohorts. (C) Violin plot showing mRNA expression of Tbc1d10c across CD8 T-cell subsets. Each black dot represents a cell, and T-cell subtypes are color-coded. (D) Mean-z score heatmap showing the arithmetic mean of the z scores for the top 25 DEGs CD8+ T cells in Tbc1d10c+/+and Tbc1d10c−/− scRNA-Seq integrated data sets (PAdj < 0.05). (E) Volcano plot from LC-MS/MS global proteomic analysis of Tbc1d10c+/+and Tbc1d10c−/− CD8 T cells (n = 3 replicates per group, P values determined by unpaired Student’s t-test with permutation-based FDR correction). (F) Gel images and bar graph (densitometric quantification) showing immunoblot detection of Dnaja1 and Epsti1 in Tbc1d10c+/+and Tbc1d10c−/− CD8 T-cell lysates (n = 2 replicates per group). (G) Bar graphs showing relative mRNA expression of Epsti1 and IκBα as determined by QPCR (n = 3 per replicates per group). (H-I) Gel images (H) and densitometric quantification (I) of relative Epsti1 and IκBα protein levels in unstimulated and CD3/CD28-stimulated cells (n = 2 replicates per group). P values were determined by unpaired Student’s t-test (*, < 0.05; **, < 0.04; ***, < 0.02).
