Figure 5.

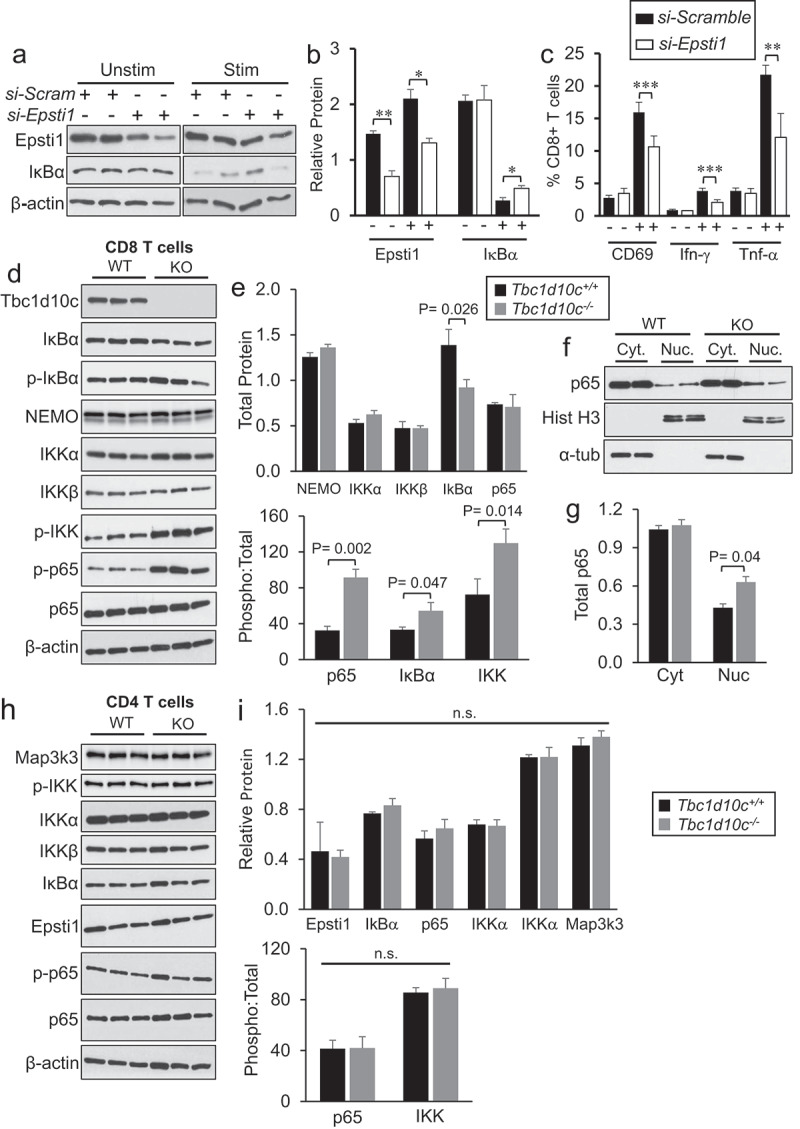
NF-κB pathway activation in CD8 T cells. (A-B) Gel images (A) and densitometric quantification bar graphs (B) showing relative protein levels for Epsti1 and IκBα in wild-type CD8 T cells after siRNA knockdown of Epsti1 (n = 2 replicates per group). (C) Bar graphs showing the average percentages of si-Scramble-or si-Epsti1-transduced CD8 T cells positive for CD69 (A), Ifn-γ (B) or Tnf-α (C) following 24 hr co-stimulation with CD3/CD38 antibodies. (D-I) Gel images and densitometric quantification (bar graphs) showing relative protein levels for CD8 T-cell lysates (D-G) or CD4 T-cell lysates (H-I) of total and phosphorylated protein levels of canonical NF-κB pathway members (n = 3 per replicates per group). Abbreviations: Cyt, cytoplasmic fraction; Nuc, nuclear fraction. P values were determined by unpaired Student’s t-test.
