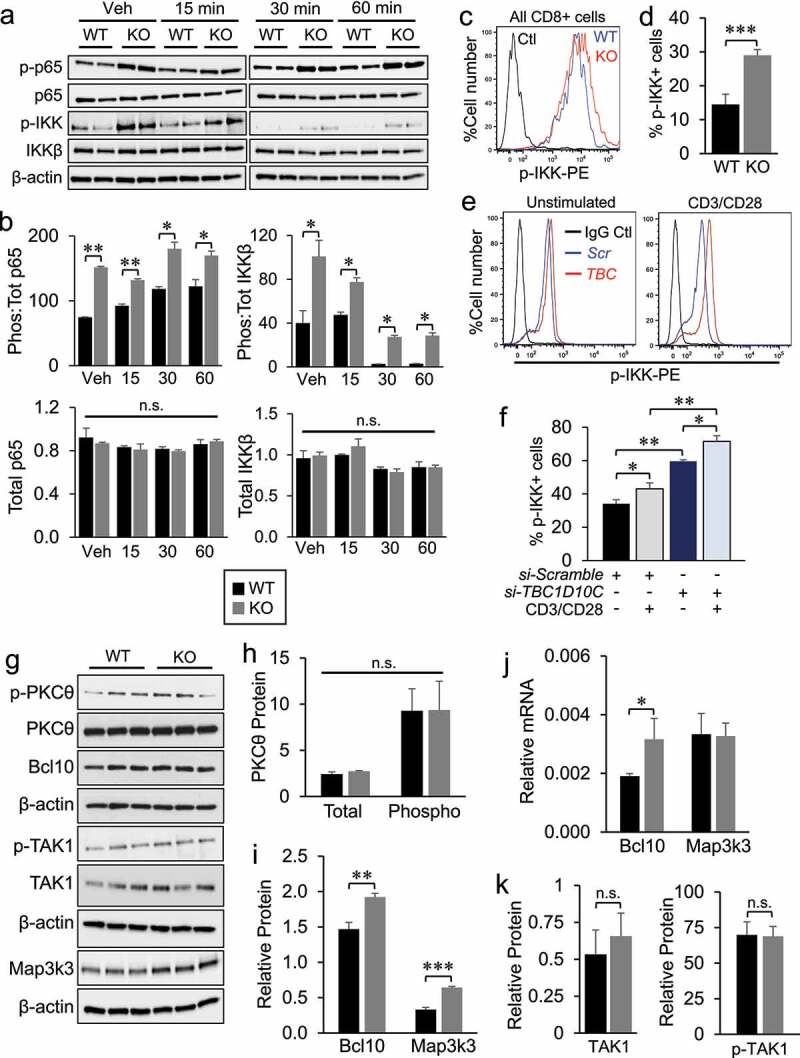
Figure 6.

Assessment of IκBα and Map3k3 expression in Tbc1d10c−/− CD8 T cells. (A-B) Gel images (A) and densitometric quantification (B) of total and phosphorylated p65 and IKKβ protein levels in Tbc1d10c+/+and Tbc1d10c−/− CD8 T cells following CD3/CD28 activation at the indicated time points (n = 2 replicates per group). (C-D) Representative dot plots of flow cytometric detection of p-IKK levels of SCC-infiltrating CD3+ CD8 + T cells and bar graph (D) showing average percentage of p-IKK+ CD8 T cells (n = 4 tumors per group). Histogram shows an overlay of representative p-IKK+ cell numbers in Tbc1d10c+/+and Tbc1d10c−/− cohorts. (E) Representative dot plots of flow cytometric detection of p-IKK+ human CD8 T cells subjected to TBC1D10C siRNA or control (si-Scramble) silencing and vehicle (unstimulated) or CD3/CD28 stimulation. (F) Bar graph showing the average percentage of p-IKK+ human CD8 T cells subjected to TBC1D10C siRNA or control (si-Scramble) silencing and CD3/CD28 stimulation (n = 5 replicates per group). (G-I) Gel images and densitometric quantification (bar graphs) showing relative total and phosphorylated protein levels of indicated proteins in Tbc1d10c+/+and Tbc1d10c−/− CD8 T cells (n = 3 replicates per group). (J) Bar graphs showing relative mRNA expression of Bcl10 and Map3k3 as determined by QPCR (n = 3 per replicates per group). (K) Bar graphs showing relative total and phosphorylated TAK1 protein levels in Tbc1d10c+/+and Tbc1d10c−/− CD8 T cells from panel G (n = 3 replicates per group). P values were determined by unpaired Student’s t-test.
