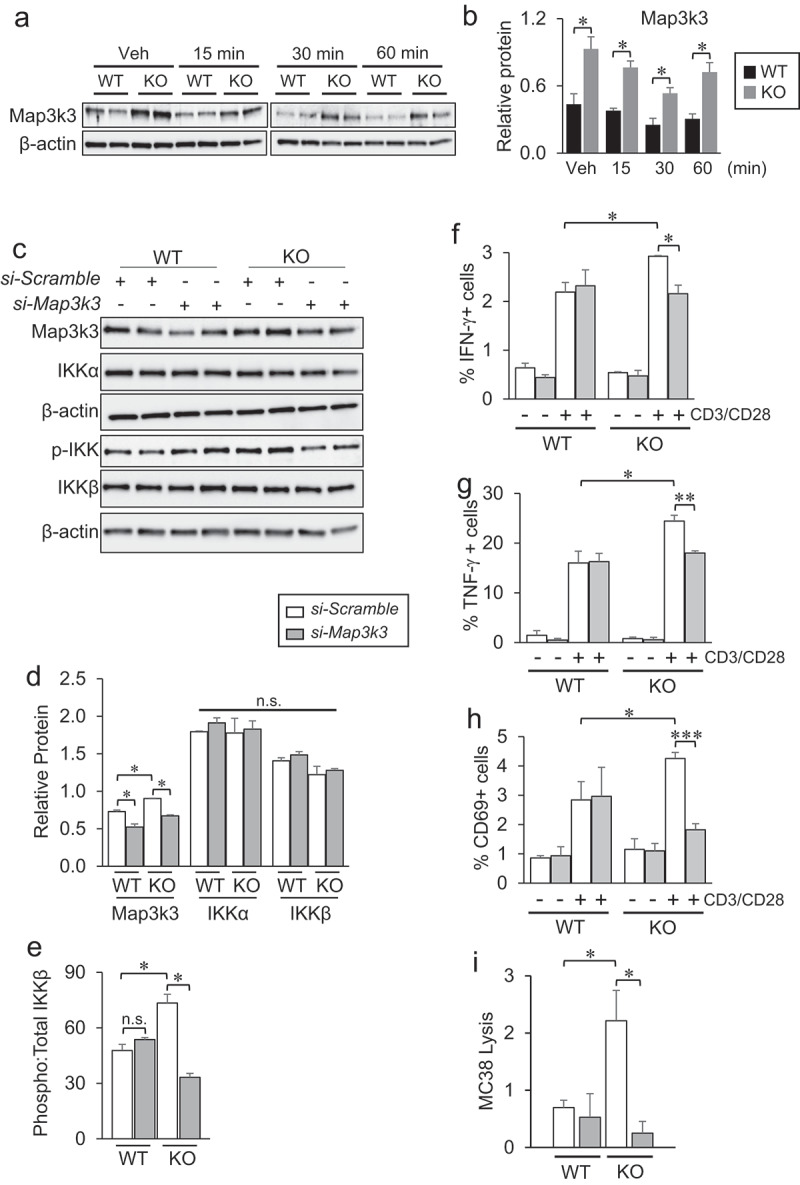
Figure 7.

Map3k3 knockdown rescues the Tbc1d10c null phenotype in CD8 T cells. (A-B) Gel images (A) and densitometric quantification (B) of total Map3k3 protein levels in Tbc1d10c+/+and Tbc1d10c−/− CD8 T cells following CD3/CD28 activation at the indicated time points (n = 2 replicates per group). (C-E) Gel images and densitometric quantification (bar graphs) showing relative total and phosphorylated protein levels of indicated proteins in Map3k3 siRNA knockdown Tbc1d10c−/− CD8 T cells (n = 2 per replicates per group). (F-H) Percent of Ifn-γ+ (F), Tnf-α+ (G) and CD69+ (H) CD8 T cells following siRNA silencing of Map3k3 and CD3/CD28 stimulation (n = 3 replicates per group). (I) Bar graph showing MC38 lysis levels by OT-I;Tbc1d10c+/+and OT-I;Tbc1d10c−/− CD8 T cells following Map3k3 siRNA silencing at a 2:1 effector-to-target cell ratio (n = 3 per replicates per group). P values were determined by unpaired Student’s t-test (*, P < .05; **, P < .005; ***, P < .0005).
