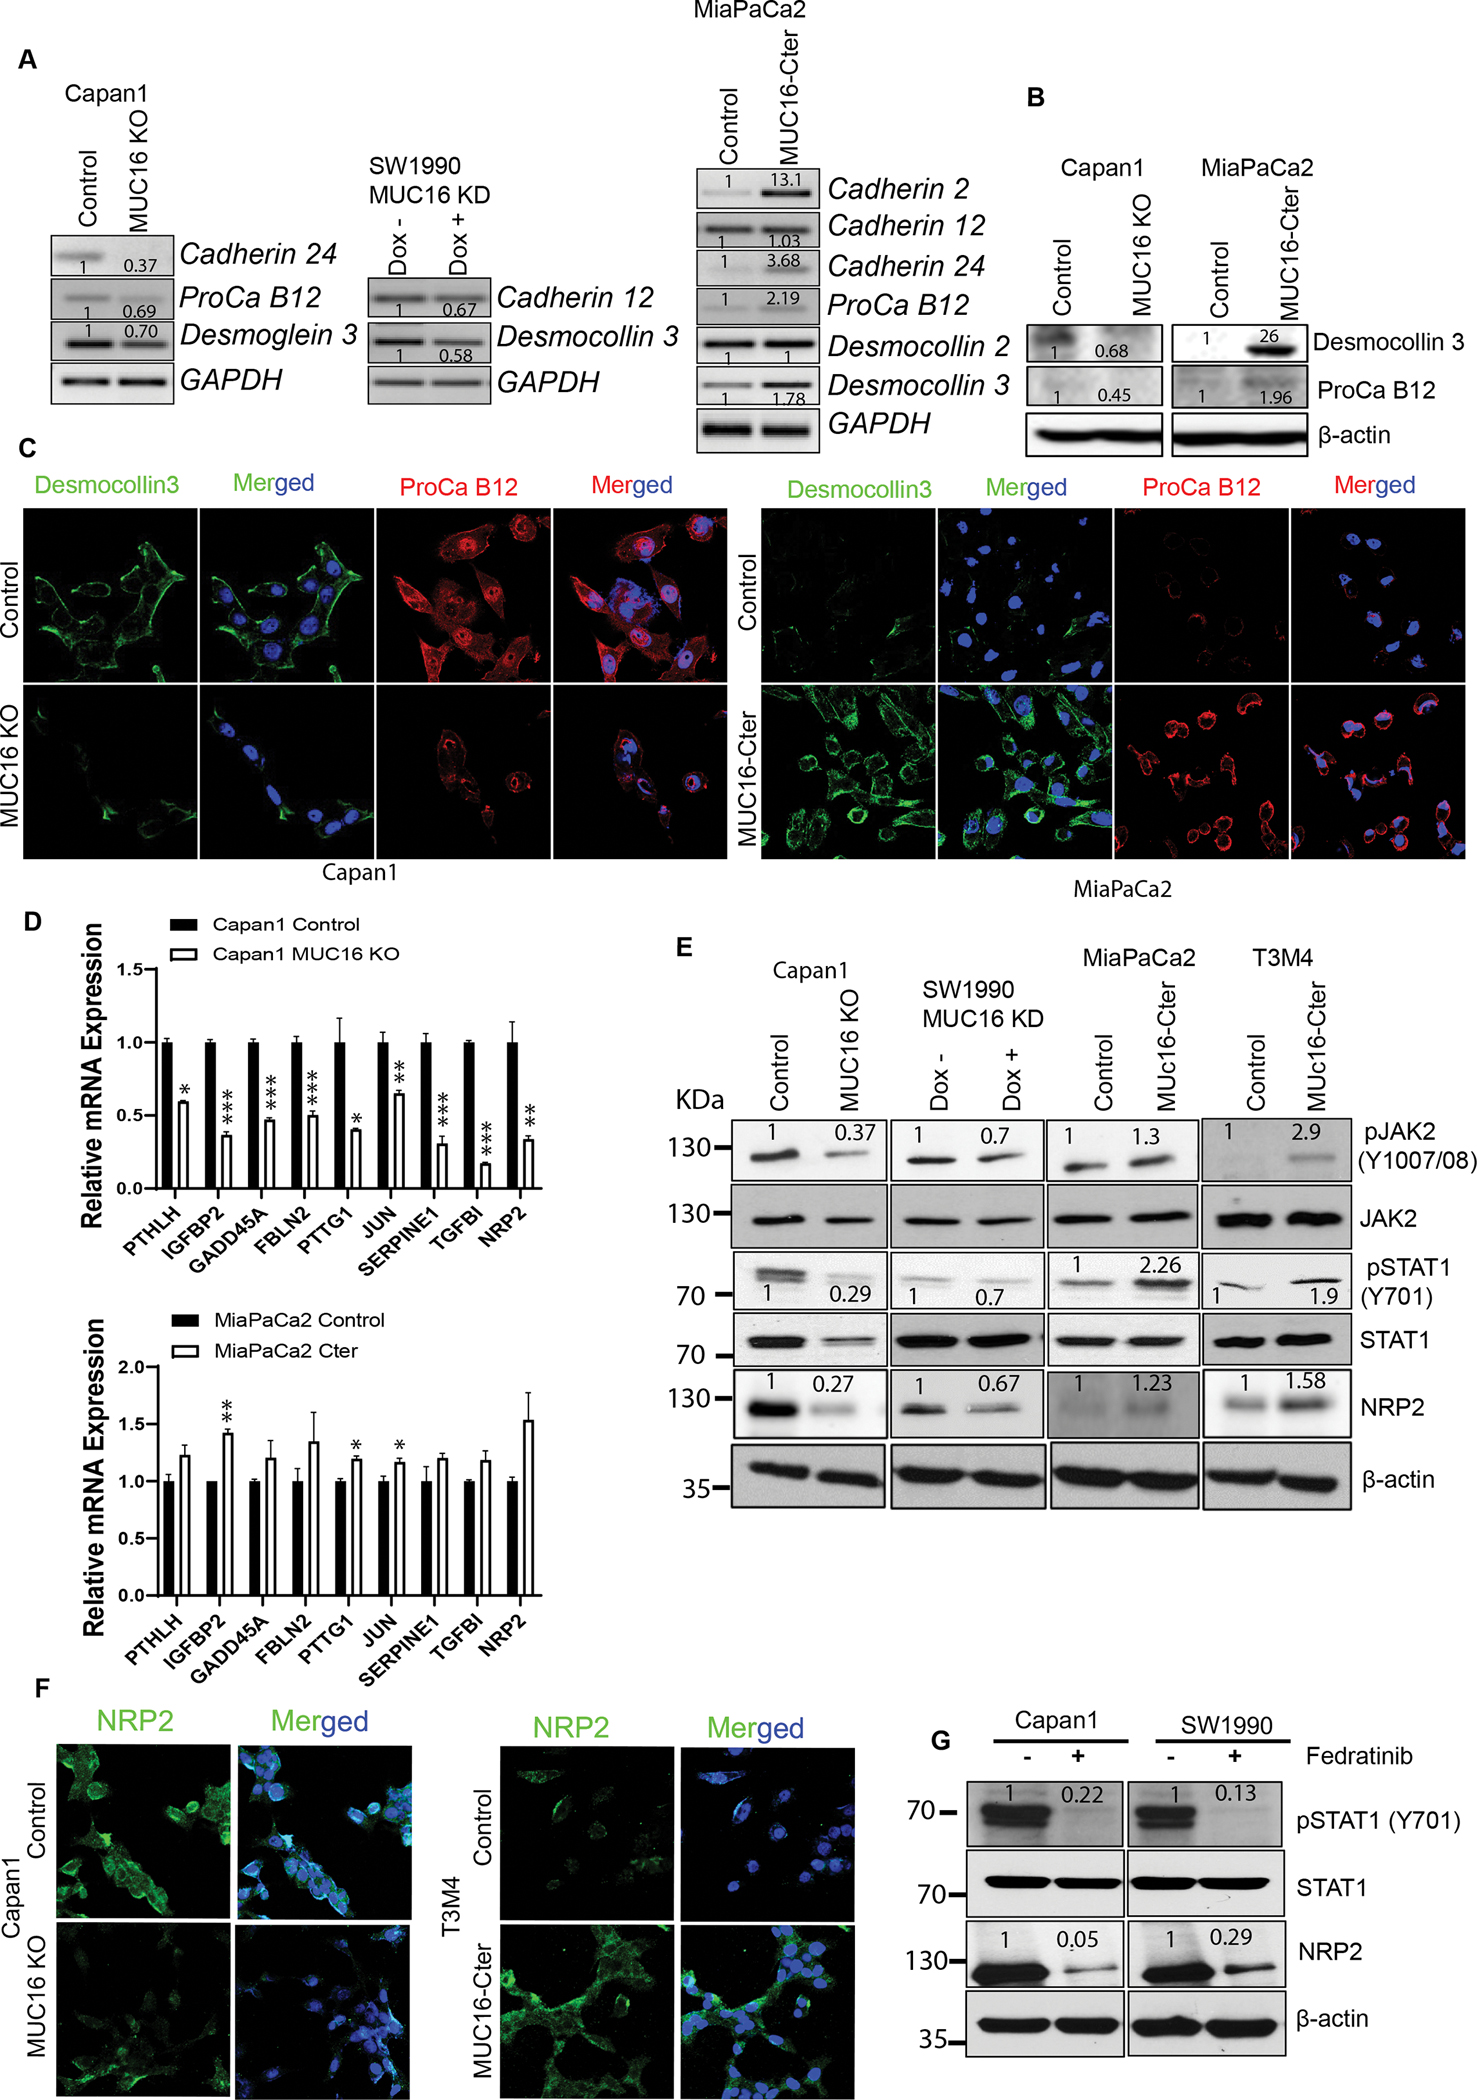
Figure 5. MUC16 regulation of cell adhesion-promoting molecules and metastatic gene NRP2 regulation through activation of JAK2/STAT1 axis.

A) PCR analysis shows mRNA expression of cell adhesion molecules in Capan1 MUC16 KO, SW1990 MUC16 KD, and MUC16-Cter overexpressed MiaPaCa2 cells with control cells. GAPDH was used as a loading control. B, C) Immunoblot and immunofluorescent staining of cell adhesion molecules, Desmocollin 3 (green) and Protocadherin B12 (red) expression in MUC16 KO and MUC16-Cter overexpressed PC cells with respective control cells. Immunofluorescence images were taken under the confocal microscope; scale bar, 50 μm. D) QRT-PCR validation of 10 common genes in Capan1 MUC16 KO and MiaPaCa2 MUC16-Cter overexpressed cells. Data represent ± standard deviation (Student’s t-test calculates p values (***p<0.001, **p<0.01, *p<0.05) (n=3). E) Immunoblot analysis shows the phospho-JAK2 (Y1007/1008), total JAK2, phospho-STAT1 (Y701), total STAT1 and NRP2 expression in Capan1 MUC16 KO, SW1990 MUC16 KD, MiaPaCa2 MUC16-Cter, and T3M4 MUC16-Cter overexpressed cells. β-actin was used as a loading control. F) Immunofluorescence analysis was performed to show the NRP2 expression in MUC16 KO and MUC16-Cter overexpressed PC cells. Images were obtained from a confocal microscope; scale bar, 50 μm. G) Effect of silencing the JAK2 activation using JAK2 inhibitor (Fedratinib) in Capan1 and SW1990 cells. Immunoblot analysis shows the phospho-STAT1 (Y701), total STAT1, and NRP2 expression in Capan1 and SW1990 cells. β-actin was used as a loading control. Western blots were quantified by densitometric analysis.
