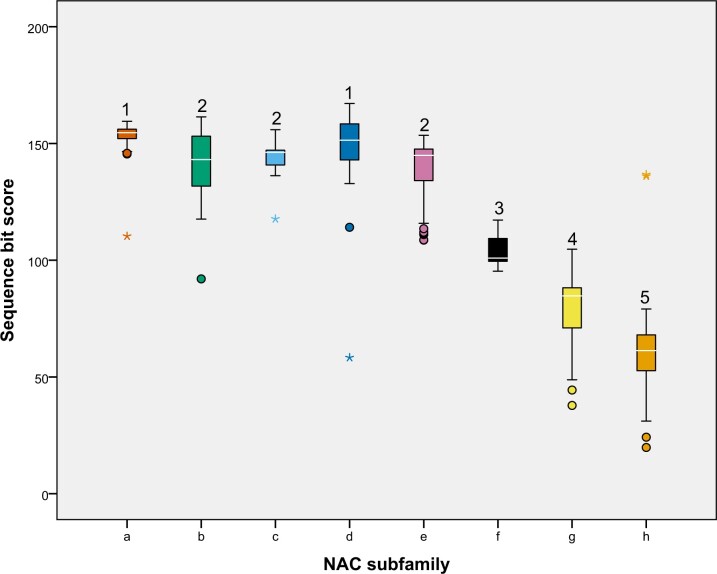
Fig. 5.
The sequence bit scores from HMMER output across the TaNAC subfamilies. The sequence bit scores indicate the probability of a TaNAC sequence being homologous to the hmm profile of the NAM domain (Finn et al. 2011). Within the boxplots, the white line denotes the median. Outliers and extreme values, below or above whiskers, are marked with the circle or the star, respectively. Boxplots that do not share the same number above whiskers are significantly different (P-value <0.05).

