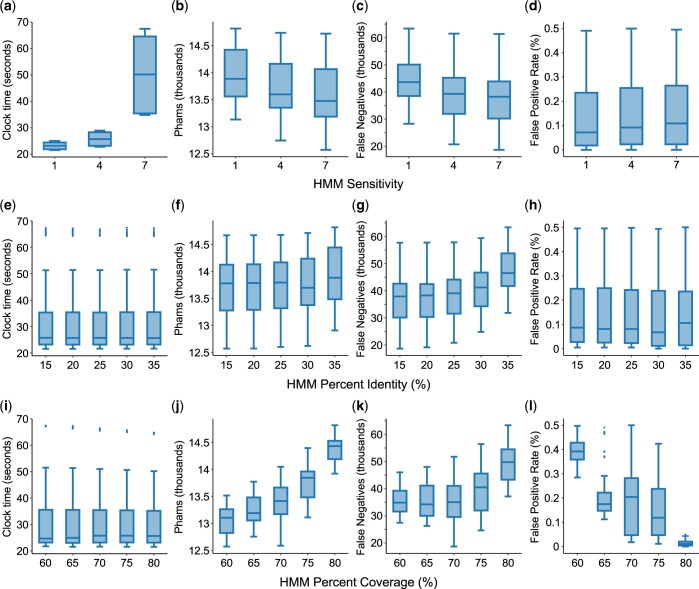
Fig. 4.
The impact of sensitivity, identity, and coverage on profile–sequence clustering with MMseqs2. The runtime (in seconds), number of phams, number of false negatives, and false positive rate were plotted for each value of sensitivity (a–d), percent identity (e–h), and percent coverage (i–l) tested. False-positive rate was calculated as the number of genes determined to be false positives in their respective phams divided by the number of genes being clustered (see Materials and Methods for identification of false positives and negatives). Sensitivity (-s), percent identity (–min-seq-id), and percent coverage (-c) are as described in Fig. 2. Parameter sets producing false positives above a rate of 0.5% were omitted from this analysis.

