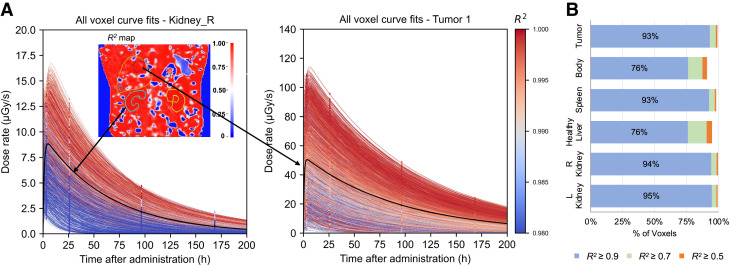
FIGURE 4.
(A) Example dose-rate curve fittings for all voxels in right kidney and tumor 1 of patient 12, color-coded by R2 value of fit. Mono- and biexponential functions are selected for different voxels. Organ-level curve fitting is shown in black. Coronal slice of R2 map is shown in insert. (B) Percentage of voxels achieving R2 > 0.5, 0.7, and 0.9 for fits across all patients.

