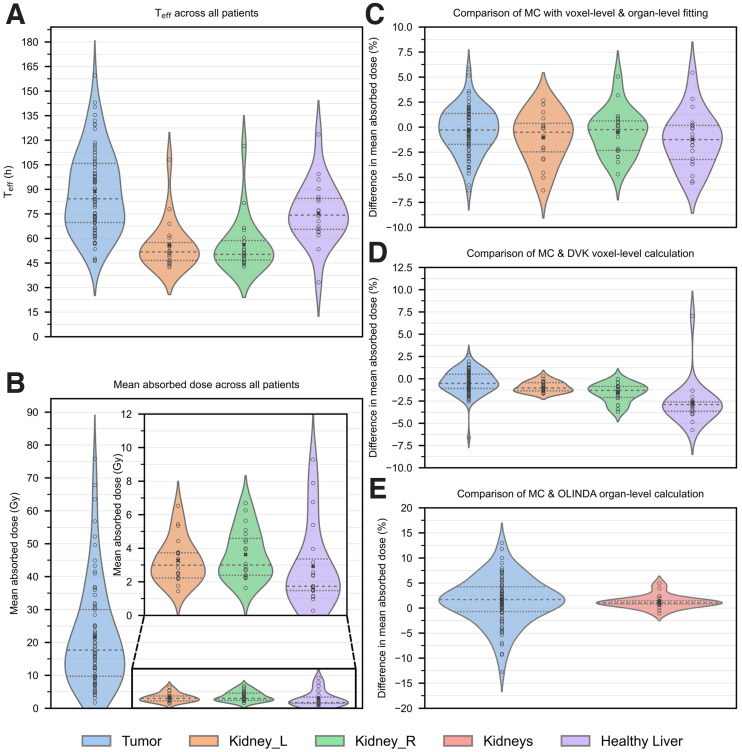
FIGURE 6.
Violin plots of dosimetry results across all patients. (A) Teff. (B) Mean absorbed dose with voxel-level MC calculation. (C) Difference in MC dose estimates with voxel-level vs. organ-level dose-rate fitting. (D) Difference between MC and DVK (with density scaling). (E) Difference between MC and OLINDA (with mass scaling). Difference = 100 × (MC − XX)/MC, where XX indicates the other method. Circles indicate individual points, “x” indicates the average across patients, and dashed lines indicate 25th and 75th percentiles.

