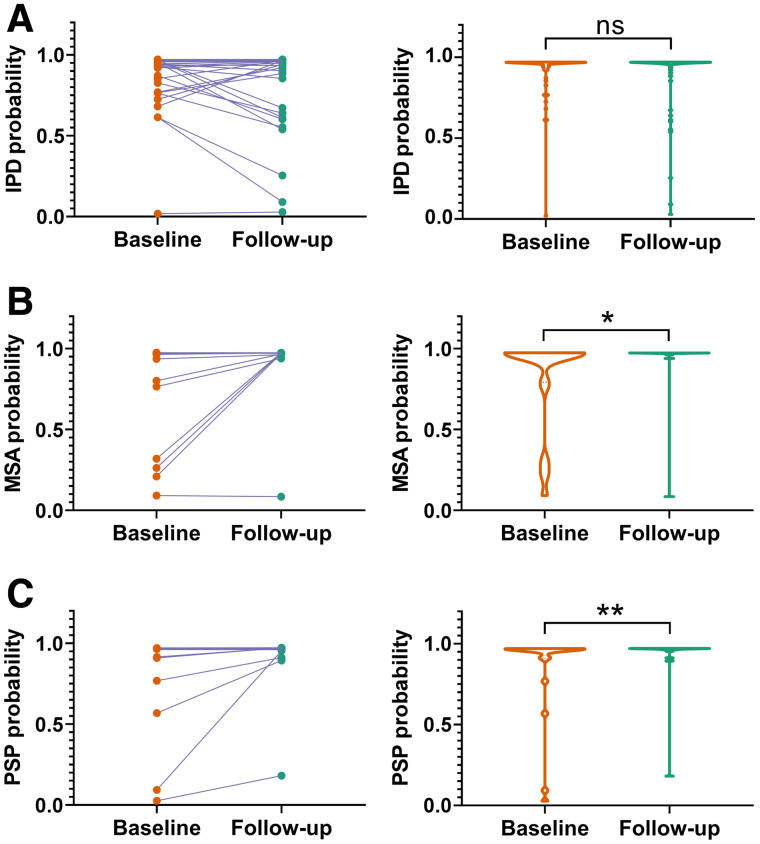
FIGURE 4.
Comparison of probabilities of IPD (A), MSA (B), and PSP (C) of DMI indices on the 108 patients in blind-test cohort with repeated PET scans. (Left column) Comparison of the probability of DMI indices extracted from baseline and follow-up PET for individuals. (Right column) Violin plots demonstrate statistical distribution of probabilities of DMI indices. *P ≤ 0.05. **P ≤ 0.01. ns = no significance.

