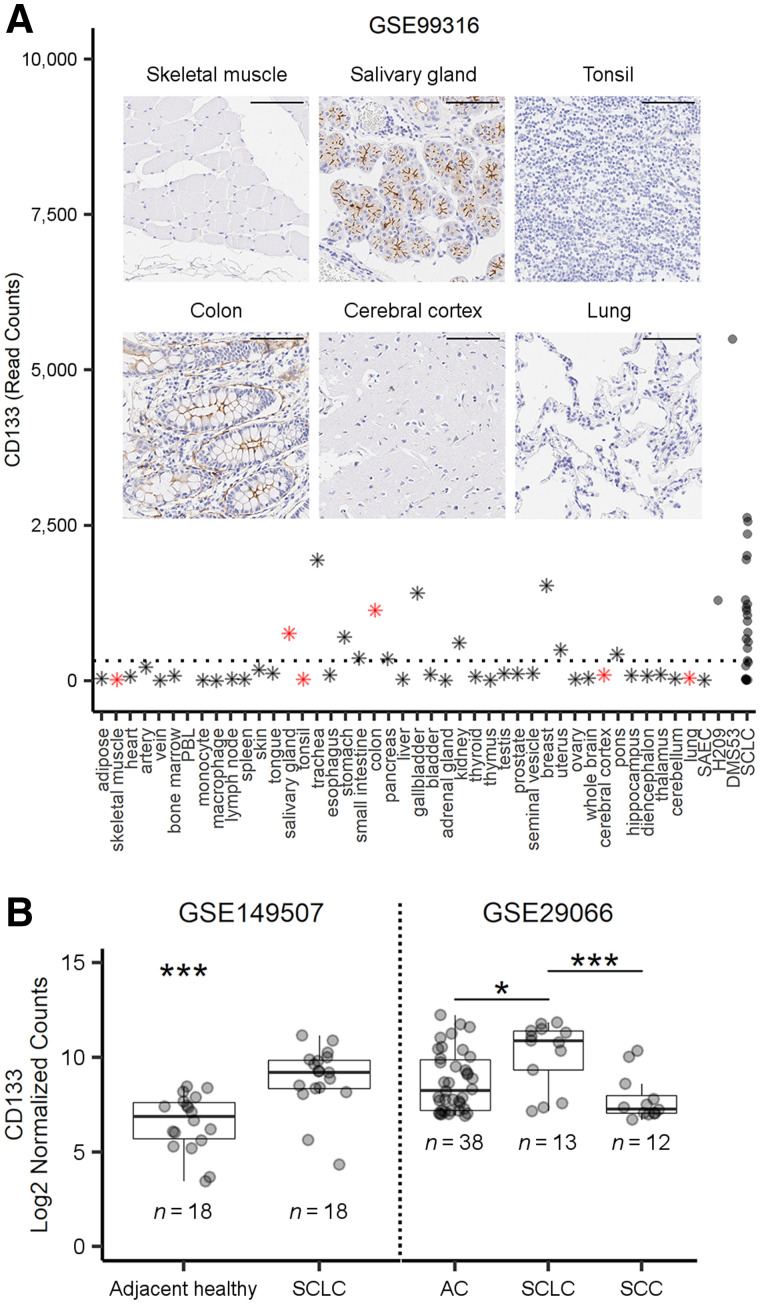
FIGURE 1.
Expression of CD133 in normal tissue and SCLC. (A) RNA sequencing data for CD133 in healthy organs (n = 42), SAEC (n = 1), SCLC cell lines (n = 2), and SCLC patient tumors (n = 23). PBL = peripheral blood leukocytes; SAEC = small airway epithelial cell. Dashed line represents average expression across all healthy tissue/organs (exclusive of H209, DMS53, and SCLC). Inset shows CD133 protein immunohistochemistry staining (brown) at ×20 in tissue microarrays from selected normal tissues (red stars in A; scale, 100 μm). (B) Representative expression levels of CD133 messenger RNA, from publicly available cohorts, in adjacent healthy or tumor tissue from SCLC patients and between SCLC, adenocarcinoma (AC), and squamous cell carcinoma (SCC) tumors. *P < 0.05 by t test or 1-way ANOVA with Tukey adjustment. ***P < 0.001 by t test or 1-way ANOVA with Tukey adjustment.

