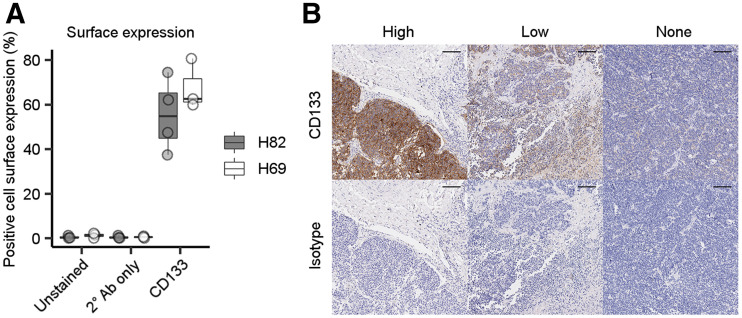
FIGURE 2.
Characterization of expression of CD133 protein in SCLC. (A) Flow-cytometric detection of CD133 expression in H82 and H69 SCLC cell lines (4 experimental replicates per cell line). (B) Representative images of high, low, or absent CD133 expression (top; brown staining) or isotype control (bottom) from SCLC tissue microarray (scale, 100 μm).

