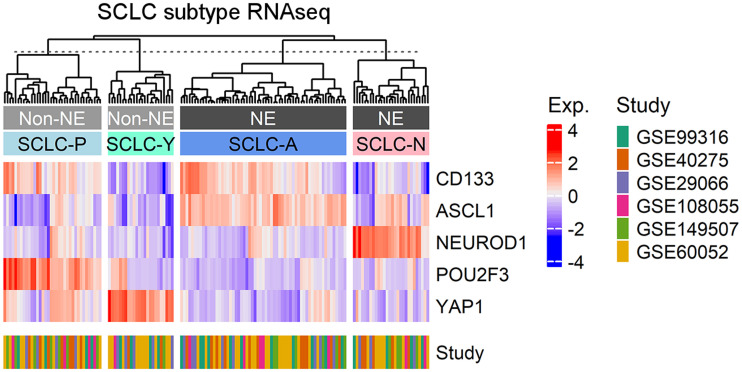
FIGURE 3.
Clustering of CD133 expression and subtype markers in SCLC. RNA sequencing data from SCLC Gene Expression Omnibus data were used to construct heat map of CD133 and SCLC subtype marker expression using ComplexHeatmap R package with clustering using Ward.D2 method. z score of expression was calculated using scale function in R. Clusters are labeled by their characteristics (neuroendocrine [NE] or nonneuroendocrine [non-NE]) and by subtype (SCLC-A/N/P/Y). RNAseq = RNA sequencing.

