FIGURE 5.
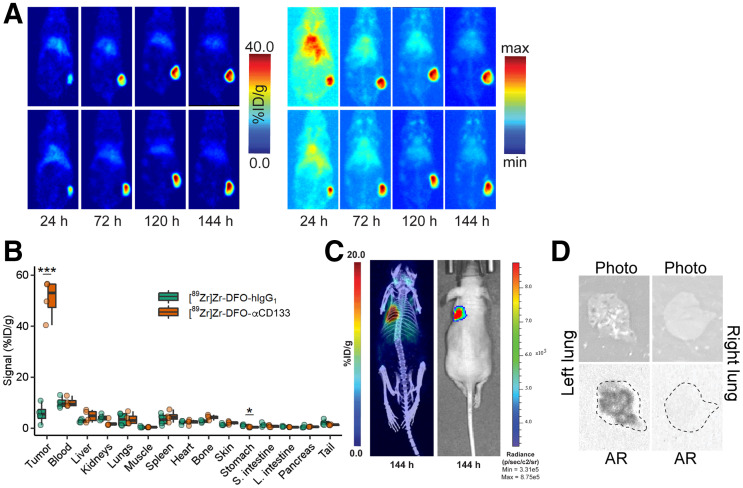
In vivo validation of [89Zr]Zr-DFO-αCD133. (A) Representative coronal slice (left) and maximum-intensity-projection (right) PET images acquired 24, 72, 120, and 144 h after intravenous administration of [89Zr]Zr-DFO-αCD133 (3.7 − 3.9 MBq, 10–10.5 μg) to athymic nude mice (n = 4) bearing subcutaneous H82 xenografts (150–200 mm3 at time of injection). For maximum-intensity-projection images, minimum is 0% and maximum is 100%. (B) Biodistribution data acquired 144 h after intravenous administration of [89Zr]Zr-DFO-αCD133 (3.7–3.9 MBq, 10.0–10.5 μg) or [89Zr]Zr-DFO-hIgG1 (3.3–3.5 MBq, 36–38 μg) to athymic nude mice (n = 4 per cohort) bearing subcutaneous H82 xenografts. *P < 0.05 using 2-way ANOVA and Bonferroni adjustment. ***P < 0.0001 using 2-way ANOVA and Bonferroni adjustment. (C) Representative maximum-intensity-projection PET/CT (left) and bioluminescence images (right) acquired 144 h after intravenous administration of [89Zr]Zr-DFO-αCD133 (3.7 − 3.9 MBq, 5–5.5 μg) to athymic nude mice (n = 4) bearing orthotopic H82-luc xenografts in parenchyma of left lung. (D) White-light images and autoradiographs of left and right lungs of mouse shown in C; dotted lines in autoradiographs represent outline of lung.

