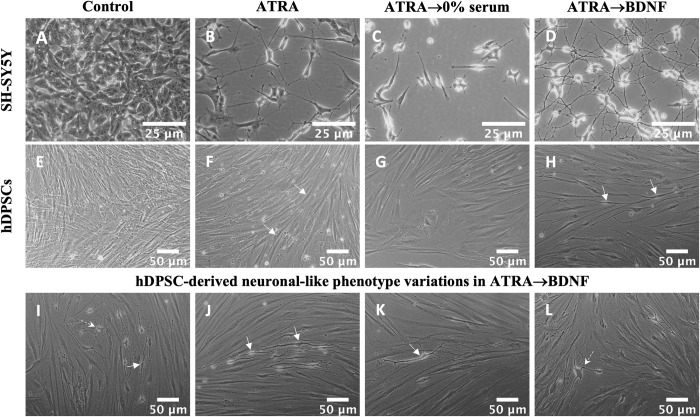
Fig 1. Neural differentiation of SH-SY5Y and hDPSC experimental groups.
(A-D) Phase contrast images of SH-SY5Y groups; (A) control, (B) ATRA, (C) ATRA→0% serum, and (D) ATRA→BDNF. (E-L) Phase contrast images of hDPSC groups; (E) control, (F) ATRA, (G) ATRA→0% serum and (H-L) ATRA→BDNF. The phase contrast images were background corrected and converted to 8-bit images. Scale bars are shown. Solid arrows indicate bipolar elongation/morphology; dotted arrows indicate multipolar neuronal-like morphology.

