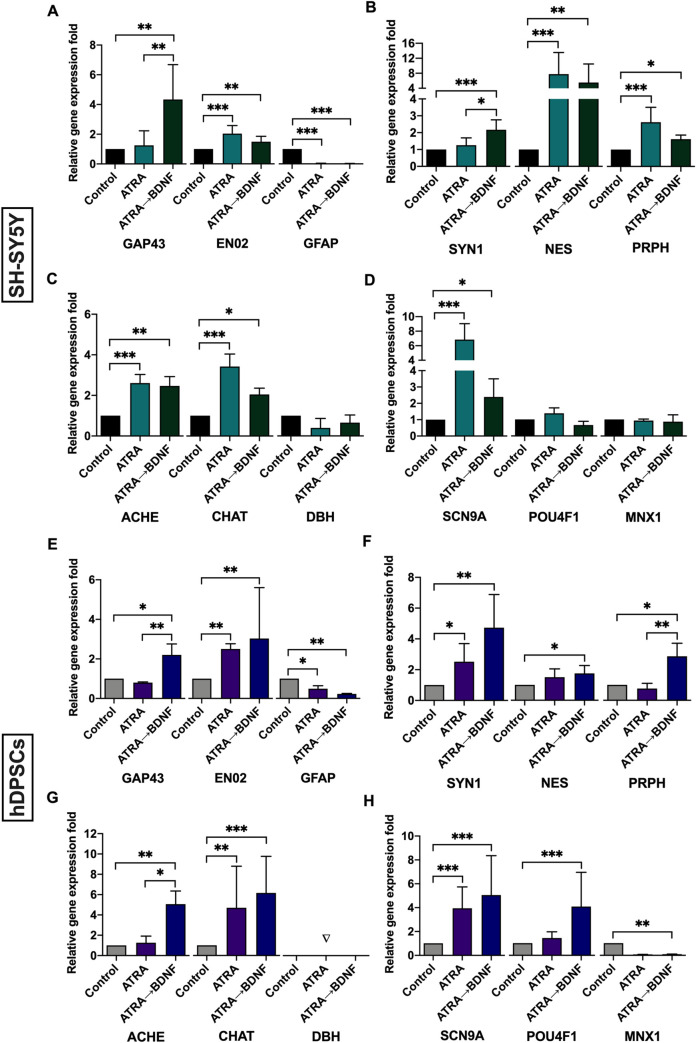
Fig 4. Quantitative gene expression of specific neuronal markers as determined by real-time qPCR.
(A-D), Experimental groups of SH-SY5Y. (E-H), Experimental groups of hDPSCs. Fold change was calculated using the Pfaffl method and normalized against the most stable housekeeping gene reference HPRT1 (SH-SY5: n = 9, except for ACHE, n = 6, CHAT, POU4F1, and MNX1, n = 3; DPSCs: n = 6, except for EN02, CHAT, SCN9A, and POU4F1, n = 9; Data plotted as mean ± SD; *P< 0.05, **P< 0.01, ***P< 0.001). Note: ▽ indicates not detected.

