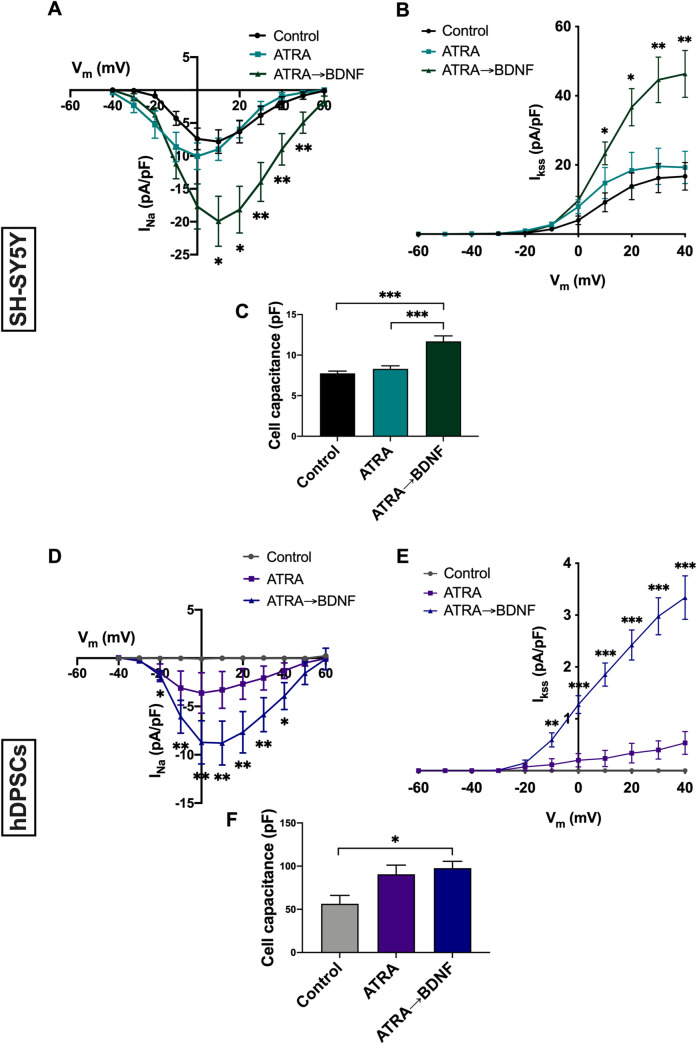
Fig 5. Patch-clamp electrophysiology analysis of neuronal differentiated SH-SY5Y and hDPSCs.
(A) Mean I-V relationship of INa in SH-SY5Y (control, n = 23; ATRA, n = 25; ATRA→BDNF, n = 21). (B) Mean I-V relationship for IKss in SH-SY5Y (control, n = 22; ATRA, n = 18; ATRA→BDNF, n = 23). (C) Mean cell capacitance in SH-SY5Y (control, n = 45; ATRA, n = 43; ATRA→BDNF, n = 44). (D) Mean I-V relationship of INa in hDPSCs (control, n = 6; ATRA, n = 10; ATRA→BDNF, n = 14). (E) Mean I-V relationship of IKss in hDPSCs (control, n = 7; ATRA, n = 6; ATRA→BDNF, n = 10). (F) Mean cell capacitance in hDPSCs (control, n = 8; ATRA, n = 6; ATRA→BDNF, n = 23). Data were analyzed by Friedman repeated measure ANOVA for comparison between measured membrane potentials of each group and Kruskal-Wallis test with a pairwise comparison for comparison between experimental groups; significance values were adjusted by Bonferroni correction. Data plotted as mean ± SEM; *, ** and *** denote P< 0.05, P< 0.01, and P< 0.001.

