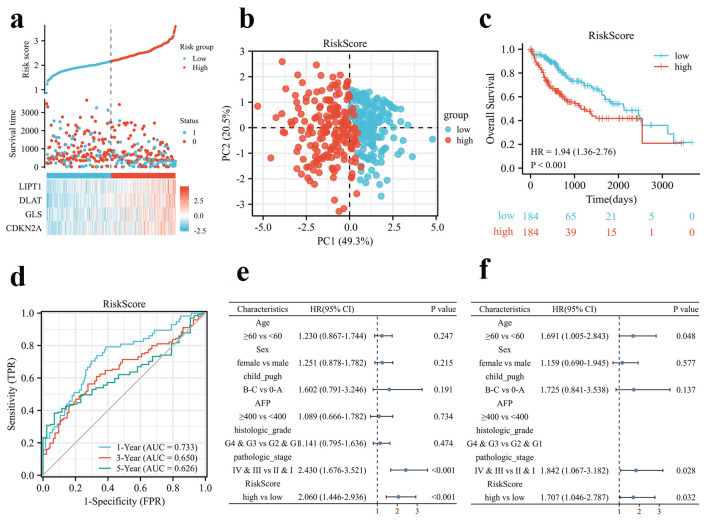
Figure 2.
Prognosis analysis of the CRGs signature in the TCGA cohort. (a) Risk scores based on CRGs prognostic signatures (above), survival of HCC patients with high- or low-risk scores (middle), and expression of four CRGs that constitute the prognostic signature in the TCGA cohort (below). (b) PCA analysis of high- and low-risk scores in the TCGA cohort. (c) Kaplan-Meier plot of OS between high- and low-risk score groups in the TCGA cohort. (d) Time-dependent ROC curves for the prognostic performance of the CRGs signature in the TCGA cohort. (e, f) Univariate (e) and multivariate (f) Cox regression analyses regarding OS evaluated the prognostic value of the CRGs signature and other factors in the TCGA cohort. HR: hazard ratio.

