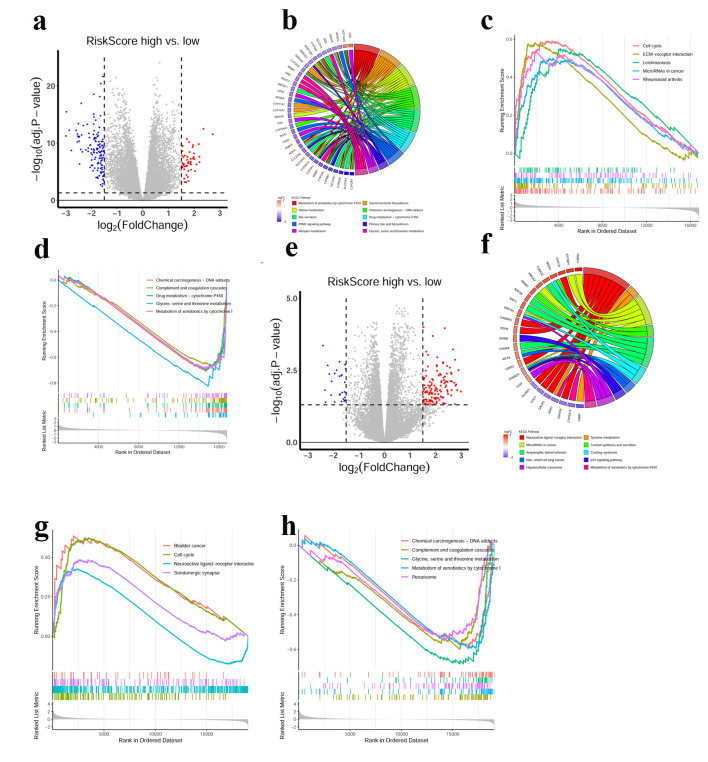
Figure 4.
Functional annotations of the CRGs prognostic signature. (a) DEGs volcano plots between high- and low-risk score groups in the TCGA cohort. Each red dot indicates an up-regulated gene, and each blue dot indicates a down-regulated gene (Fold change > 1.5, adj. P < 0.05). (b) Circle plot showed the enriched KEGG pathways of DEGs between high- and low-risk score groups in the TCGA cohort. (c, d) GSEA analysis of DEGs in the TCGA cohort. Hallmarks that significantly enriched in the high (c) and low (d) risk score groups were shown. (e) DEGs volcano plots between high- and low-risk score groups in the ICGC cohort. Each red dot indicates an up-regulated gene, and each blue dot indicates a down-regulated gene (Fold change > 1.5, adj. P < 0.05). (f) Circle plot showed the enriched KEGG pathways for the DEGs between high- and low-risk score groups in the ICGC cohort. (g, h) GSEA analysis of DEGs in the ICGC cohort. Hallmarks that significantly enriched in the high (g) and low (h) risk score groups were shown.

