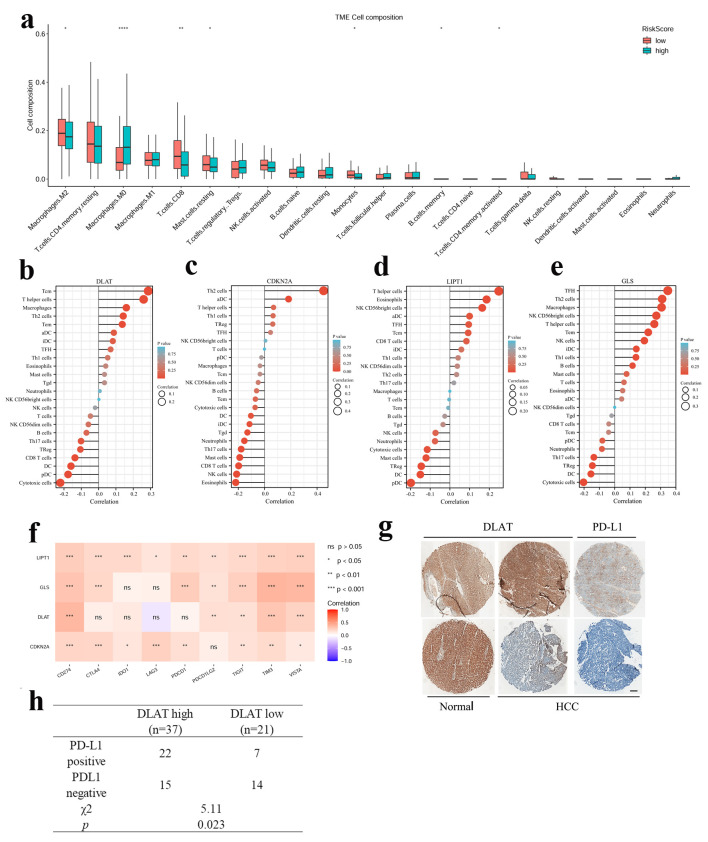
Figure 5.
Relevance between four CRGs signature and the immune microenvironment. (a) Compare of 22 immune infiltrates between high -and low-risk score HCC samples. Wilcoxon rank sum test was used for the significance test (*P < 0.05, **P < 0.01, ***P < 0.001). (b-e) Lollipop chart showed the correlation of four CRGs with tumor infiltration cells (TICs) proportion in HCC. (f) The correlation between four CRGs and immune checkpoint related genes. (g) Representative image of IHC staining of DLAT and PD-L1 in HCC and paratumor normal tissues. Up: DLAT high, PD-L1 positive. Down: DLAT low, PD-L1 negative. Scale bar = 100 µm. (h) The correlation between DLAT and PD-L1 expression in 58 HCC patients.

