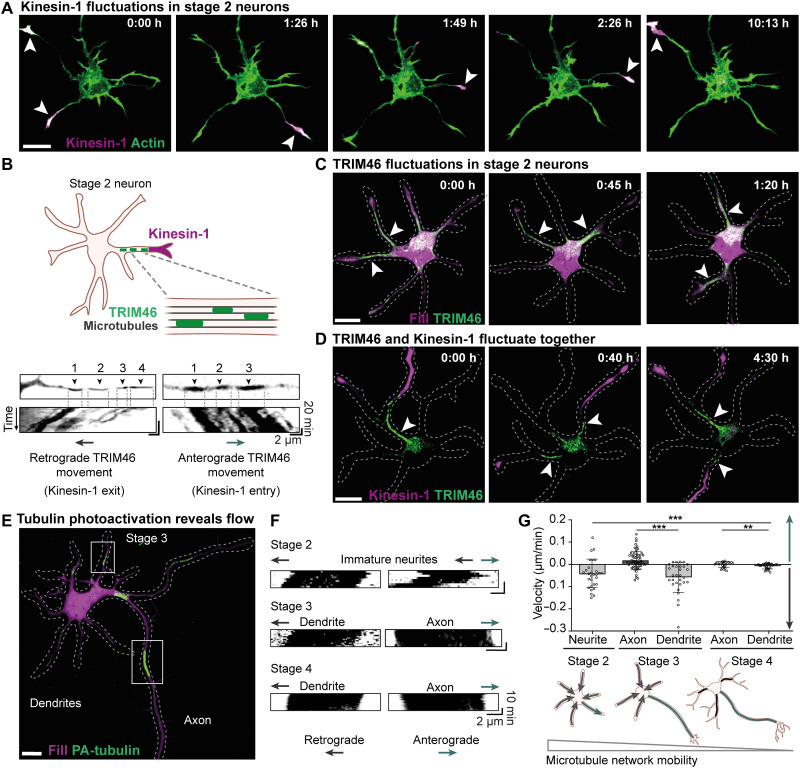
Fig. 1. Neuronal polarization and axon specification correlate with reduced retrograde microtubule network flow.
(A) Constitutively active Kinesin-1 [Kif5b(1–807)-GFP] (magenta) fluctuations between neurites of a stage 2 rat embryonic hippocampal neuron. White arrowheads indicate neurites with Kinesin-1 accumulation. (B) Directional movement of TRIM46 patches toward (retrograde) and away (anterograde) from the cell body. Top images show the start position, and kymographs show the movement of TRIM46 patches. (C) TRIM46 enrichment (green) fluctuates between different neurites of stage 2 neurons. White arrowheads indicate neurites with TRIM46 accumulation. (D) Appearance of TRIM46 (green) in a neurite (white arrowhead) is associated with Kinesin-1 (magenta) accumulation. (E) Stage 3 neuron expressing mRFP-fill (magenta) and photoactivatable tubulin (PA-tubulin). Boxes indicate PA-tubulin regions (green) in axon and dendrite used for kymographs in (F). (F) Kymographs representing movement of PA-tubulin regions at stage 2 to 4 neurons. (G) Top: Velocities of anterograde and retrograde microtubule flow (PA-tubulin movement) in stage 2 neurites (n = 29 regions), stage 3 dendrites (n = 30 regions) and axons (n = 62 regions), and stage 4 axons (n = 25 regions) and dendrites (n = 28 regions). ***P ≤ 0.001 and **P ≤ 0.01 (Mann-Whitney test for comparison between two groups). Analysis of variance (ANOVA) for comparison between five groups, F(4,145). Scale bars, 10 μm.

