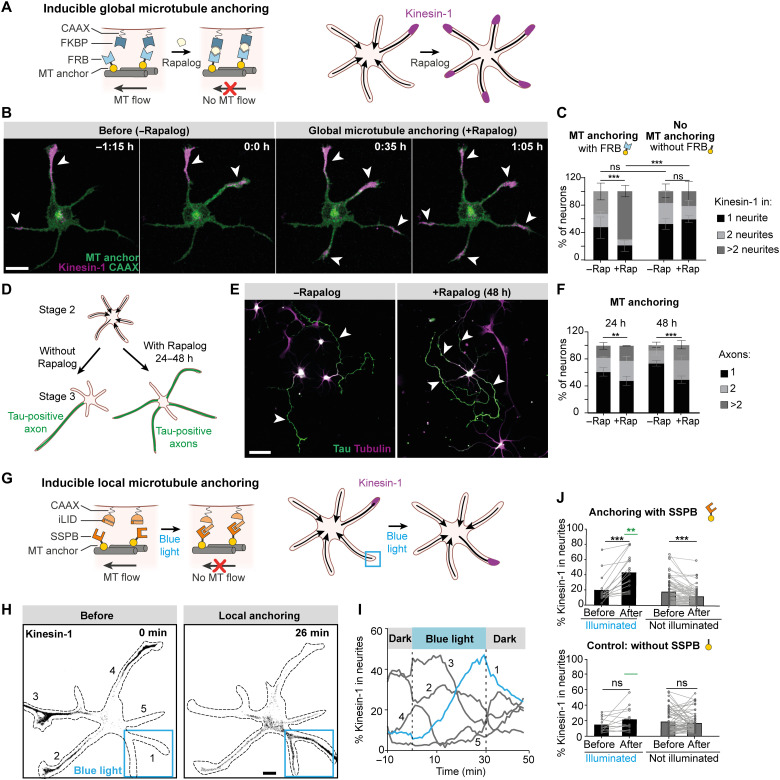
Fig. 2. Local inhibition of retrograde microtubule flow is sufficient to instruct neuronal polarization.
(A) Global microtubule (MT) anchoring assay. Rapalog induces FKBP-FRB dimerization and globally anchors microtubules to the cell membrane. (B) After global microtubule anchoring, Kinesin-1 [Kif5b(1–353)-GCN4-mCherry] (magenta) fluctuations between neurites stop and Kinesin-1 enters all neurites. Scale bar, 10 μm. (C) Percentage of stage 2 neurons with Kinesin-1 accumulation in 1, 2, or >2 neurites. With FRB module: n = 75 neurons without rapalog and n = 101 neurons with rapalog from three independent experiments. Without the FRB module: n = 79 neurons without rapalog and n = 79 neurons with rapalog from three independent experiments. Error bars represent SD. ***P ≤ 0.001 and ns (nonsignificant), P > 0.05 (chi-square test). (D) Long-term global microtubule anchoring assay. (E) Example of neurons forming single or multiple axons without or with microtubule anchoring, respectively. Scale bar, 50 μm. (F) Quantification of long-term anchoring experiments. Twenty-four-hour condition: Number of neurons without rapalog (n = 170) and with rapalog (n = 188) from three independent experiments. Forty-eight-hour condition: Number of neurons without rapalog (n = 208) and with rapalog (n = 225) from three independent experiments. Error bars represent SD. **P ≤ 0.01 and ***P ≤ 0.001 (chi-square test). (G) Light-induced local microtubule anchoring assay. (H) Kinesin-1 is relocated from neurites 2, 3, and 4 to neurite 1 upon local blue light illumination. Scale bar, 10 μm. (I) Time traces of Kinesin-1 accumulation in neurites of the neuron shown in (H). The blue trace represents the neurite illuminated by blue light. (J) Quantification of Kinesin-1 accumulation before and after blue light activation in neurites activated for 40 to 60 min and non-illuminated neurites in the same neurons. Top/bottom: Microtubule anchoring with/without SSPB module. Blue light activated pairs (n = 16/n = 13) and nonactivated pairs (n = 76/n = 58). Bars represent median values. Green lines represent comparison between illuminated neurites with and without SSPB module. ***P ≤ 0.001 (two-tailed Wilcoxon matched pair test) and **P ≤ 0.01 (Mann-Whitney test).

