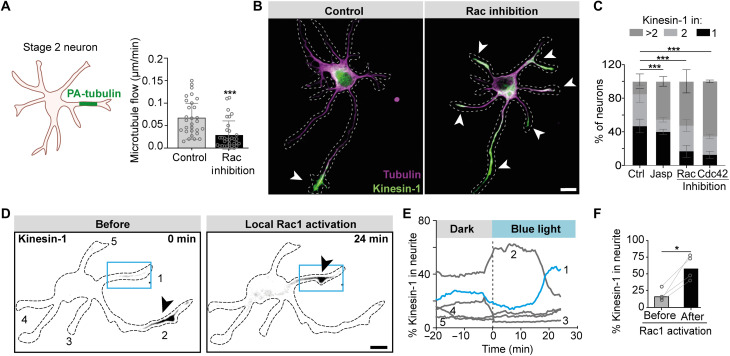
Fig. 3. Rac1 and Cdc42 control microtubule network flow and neuronal polarization.
(A) Quantification of speed of PA-tubulin regions in stage 2 neurons after Rac inhibition. Control (n = 29) and Rac inhibition (n = 32). (B) Images of stage 2 neurons expressing Kinesin-1. Kinesin-1 (green) accumulated in a single neurite in control condition but in multiple neurites after Rac inhibition. (C) Percentage of stage 2 neurons with Kinesin-1 accumulation in 1, 2, or >2 neurites. Control (n = 221), Rac inhibitor (n = 78), Cdc42 inhibitor (n = 77), and Jasplakinolide (n = 78) from three to six independent experiments. Error bars represent SD. ***P ≤ 0.001 (chi-square test). (D) Local photoactivation of Rac1 (blue box) changes selective accumulation of Kinesin-1 (gray) from neurite 2 to neurite 1 (black arrowheads). (E) Time trace of percentage of Kinesin-1 accumulation within neurites during Rac1 photoactivation. The blue trace indicates neurite 1 in which Rac1 was activated, and gray traces indicated nonactivated neurites as numbered in (D). (F) Percentage of Kinesin-1 accumulation in neurites before and after Rac1 photoactivation in stage 2 neurons. Bars indicate the median value. *P ≤ 0.05 (paired t test). (B and D) Scale bars, 10 μm.

