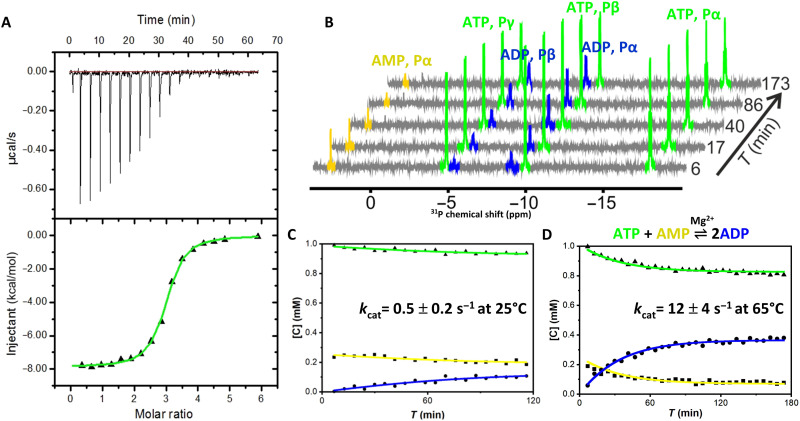
Fig. 3. OdinAK substrate-binding affinity and enzyme kinetics.
(A) ITC binding isotherm between OdinAK and ATP at 25°C. The best fitted isotherm is shown as a green line, and fitted parameters are displayed in Table 1. (B) Representative 31P NMR spectra showing the real-time evolution of mono-, di-, and trinucleoside phosphates from AMP, ADP, and ATP, respectively, over time. The experiment was initiated by mixing ATP, AMP, and Mg2+ together with catalytic amounts of OdinAK. (C and D). Quantification of enzymatic activity by a real-time 31P NMR assay at 25°C (C) and 65°C (D). The rate equations (16) were fitted to the evolution of nucleotide concentrations to obtain kcat (Table 2).

